
Core Web Vitals
Whether you are a site owner, experienced SEO professional or part of the UX team looking to improve user experience, it’s likely that you have come across Core Web Vitals at some point over the last 12 months. Google first announced web vitals metrics in May 2020 as a way to provide ‘unified guidance for quality signals’ as an initiative that puts an emphasis on user experience and how to improve page performance – you can think of it as enhanced page speed insights.
The Page Experience Update which focuses on Core Web Vitals is planned to go ahead mid-June 2021, but Google has stated that it will be a gradual roll-out, which will likely last until August 2021.
![]()
How important is page speed for your SEO performance?
Page speed has always been an important part of SEO – but even if you understand how the code on your website is written, it’s a tough job figuring out how to make it faster.
Certain CMS’s like WordPress have a lot of third party plugins that site owners can use to minify the code and compress images, but this only takes a site so far, and they often don’t meet the new thresholds for Core Web Vitals. This is because the Core Web Vitals focus on user experience and this is measured by how long it takes for certain elements on a page to load and then calculates the total blocking time, which can be broken down so that we can see exactly which elements are causing lag.
Google has invested a considerable amount of resources to better understand this and also find out how long ‘slow’ actually is. After many years of watching user behaviour across all types of websites, the research has shown that there is no single solution to improve the interactivity of a website but rather a combination of metrics that once improved on, user satisfaction went up and bounce rate went down resulting in an improvement of performance all round. For a more detailed look at the science behind the Core Web Vitals, click here.
Why is it important to improve all three Core Web Vitals metrics?
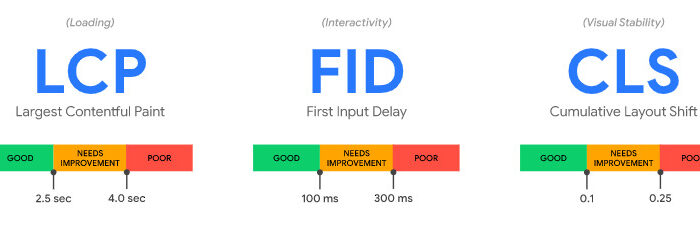
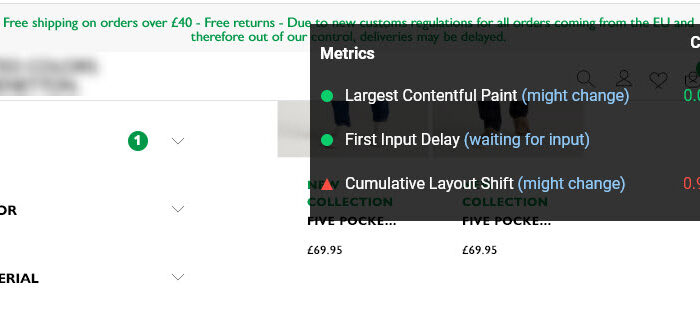
There are three main web vitals that make up the core. Combined, these are considered to be the common set of signals that define user experience needs and measure things like how quickly certain page elements load, how long it takes for the page to respond when users first interact with it and the general stability of content when a page loads:
Largest Contentful Paint (LCP) – this measures the loading time of what is likely to be the main content on a page, it’s often the biggest element on a page and above the fold.
First Input Delay (FID) – when a user begins to interact with your page, FID is measured. This could be something like clicking on a related blog post or filtering a category page on an e-commerce site.
Cumulative Layout Shift (CLS) – when a web pages loads, there may be some elements that are optimised to fit correctly on the screen that the user is browsing on, and the layout of the page shifts in order to fit these into view. CLS measures this movement.
How the Core Web Vitals will affect Google Search Results?
Google has always stated that user experience needs to be the main consideration for site owners who are trying to rank higher in the search results. Besides building a well-structured site, writing engaging content and fully embracing an E-A-T philosophy, there has been little else for digital marketers to focus on besides page speed when trying to optimise for UX. For many of us out there, the Core Web Vitals scores or page experience signals are welcomed with open arms – this is something that we actually have control over, but there will be a challenging transition period which will likely bring volatility to the search results pages after the update.
It is commonly known within the SEO community that fast websites rank better than slower performing websites for a number of reasons. Pages that resolve quickly are easier to crawl by the search engine spiders, who can then make semantic sense of a site or page quickly and rank it accordingly – instead of ending a crawl halfway through because too many resources are trying to load and then not fully understanding the context of what the site is trying to rank for. If certain elements on a page take very long to load and users end up bouncing as a result, Google will notice this type of behaviour and be more likely to reward a different site that loads quicker with higher ranks.
Are amp pages worth it?
The sites that will benefit the most from the page experience update are most likely going to be those that adopted AMP. Google has stated that the design goals for Accelerated Mobile Pages were closely aligned with how Core Web Vitals measure sites today, which means that most sites using AMP should easily be able to achieve the threshold required – as stated on a FAQ page on Core Web Vitals and page experience.
How to measure Core Web Vitals?
With Core Web Vitals becoming an official ranking factor in May 2021, Google has quickly provided six different ways for us to analyse performance across existing tools – some of which you may already be familiar with:
- Chrome Dev Tools
- Search Console
- Lighthouse
- Chrome UX Report
- Pagespeed Insights
- Web Vitals Extension
The web vitals report offer valuable insight into page performance and break down the aspects of first contentful paint, first input delay and cumulative layout shift that need improving. How actionable these recommendations are will depend on your experience – it can get very technical, so make sure that your web developers are up to speed on these performance metrics.
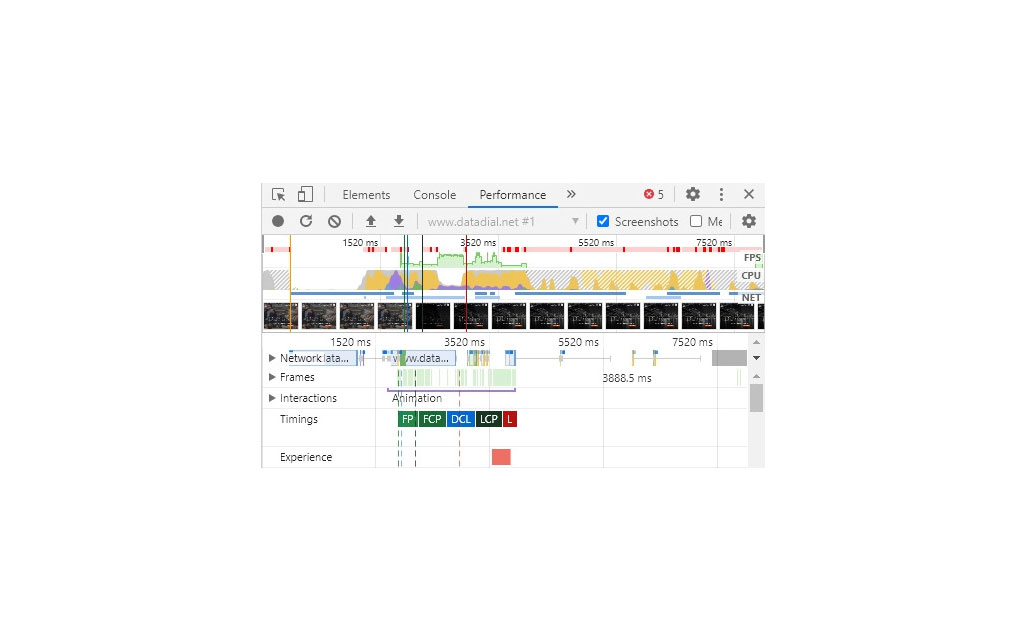
Chrome Dev Tools
Built directly into the Chrome web browser, Chrome Dev Tools allows site owners and developers to view web vitals in the DOM environment and is accessed by right-clicking and selecting Inspect Element or pressing Shift, Ctrl i at the same time. Under the performance tab you can view a cascading waterfall as all the various elements on the page load, calculating the total blocking time (TBT) which is found at the bottom of the last panel. By improving the individual load times for each element, TBT can be reduced, which is also a way to optimise for FID. You will also be able to visualize cumulative layout shift along with various other web vitals.
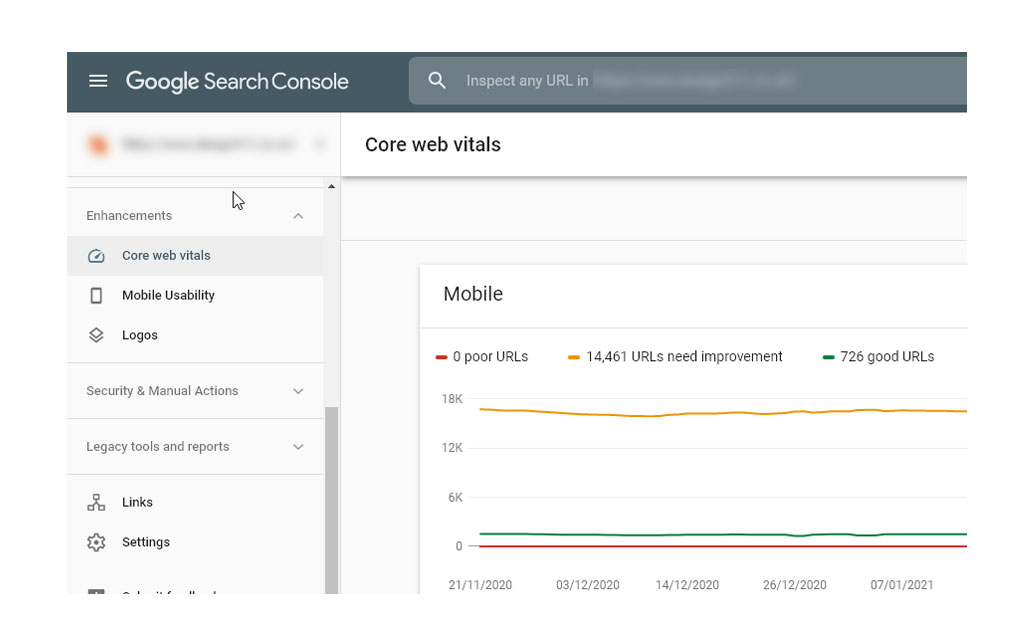
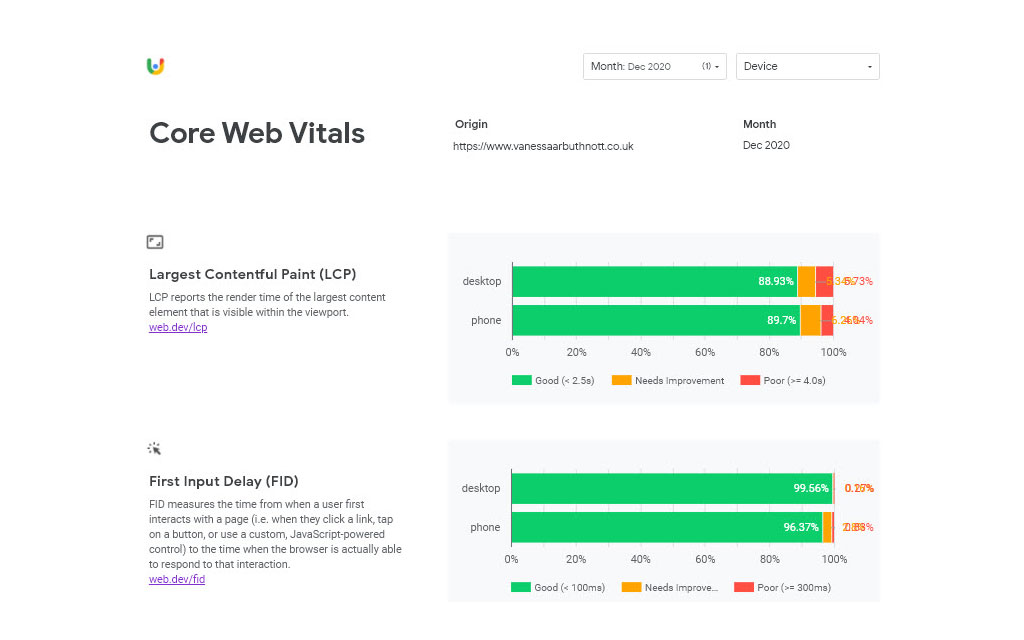
Search Console
When logging into Google Search Console, you should see the Core Web Vitals report on the left – if not, your site or certain URL’s may not have enough reporting data. This is sometimes the quickest way to discover site issues as they occur – the report is based off real user metrics (RUM) and uses the same measurements as the Chrome UX Report. Checking in on this regularly ensures that site owners are made aware of technical issues that are affecting current user experience – if any issues are found, you can quickly get examples over to your development team and start improving page experience.
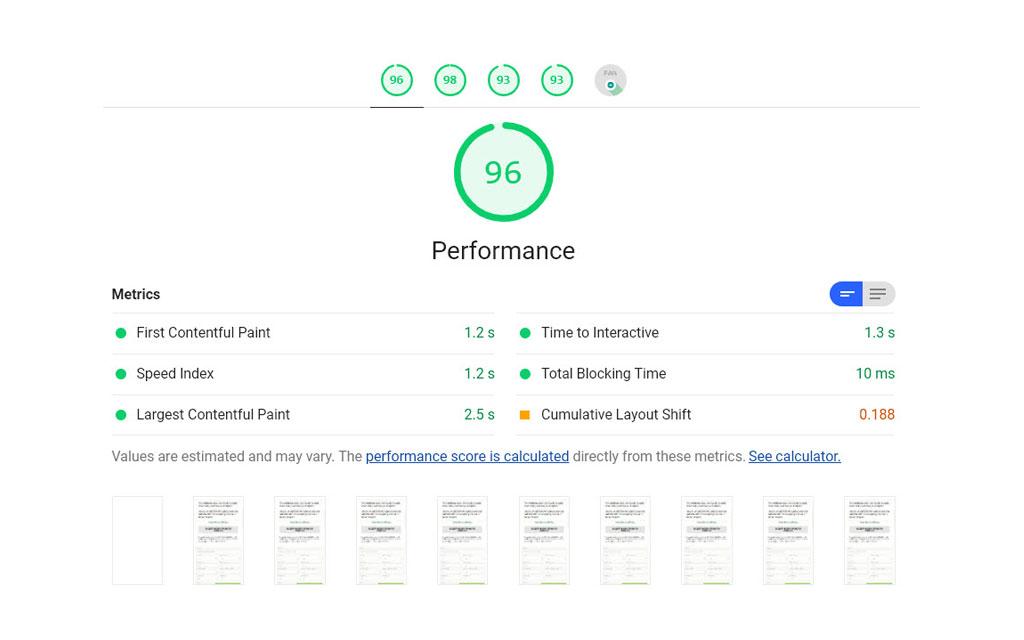
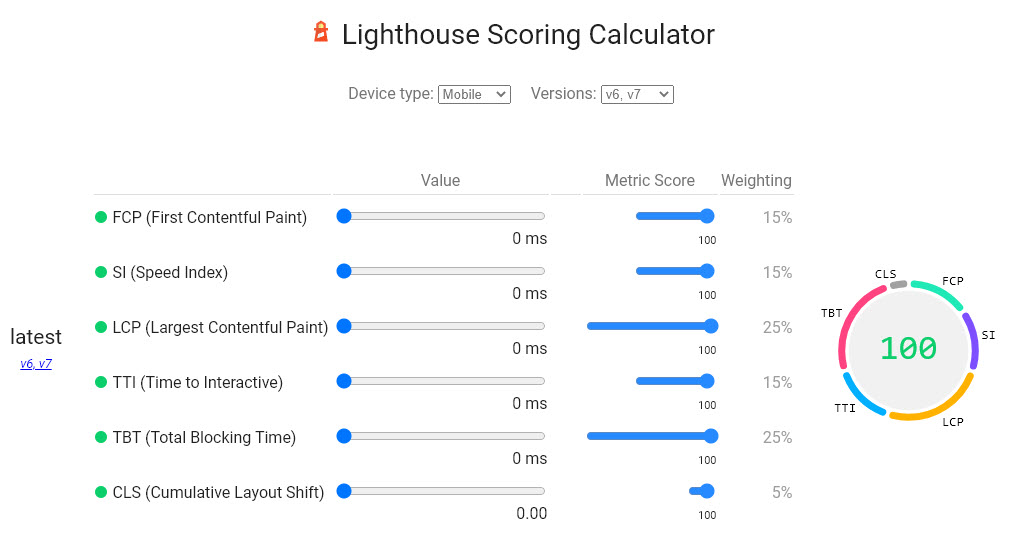
Lighthouse
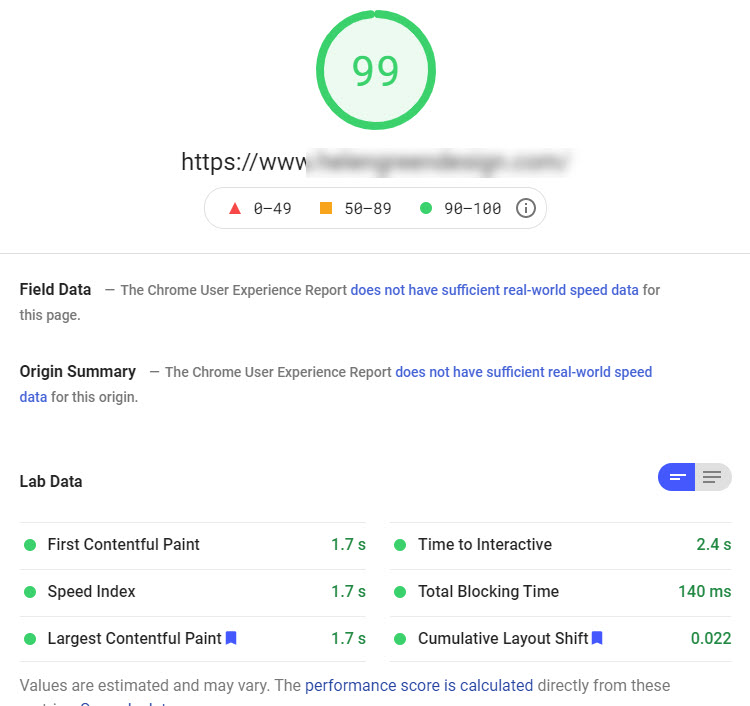
Lighthouse reports have been around for a while now, with the latest version incorporating all the Core Web Vitals (LCP, FID and CLS) and even total blocking time (TBT). There are also additional reports besides the Performance report which are well worth exploring: Accessibility, Best Practices and SEO, giving a complete technical audit of your site along with recommendations on how to fix specific issues. Keep in mind that Lighthouse uses lab data, which is a predefined configuration of browser, device and resolution. You can access Lighthouse here.
Chrome UX Report
The Chrome User Experience report (CrUX) is arguably one of the most important tools that Google has provided, and this is because the page experience score is based off real user metrics giving real world results. Gathering field data is the surest way to discover where user experience is falling short, the other tools that gathers this data similarly are Pagespeed Insights and the Core Web Vitals report in Search Console. Getting CrUX setup is slightly more complicated than the others on this list, you will need to have a Google account to access Google Cloud Projects where you’ll be able to create a BigQuery project. For more info, visit this Getting Started page for step-by-step instructions.
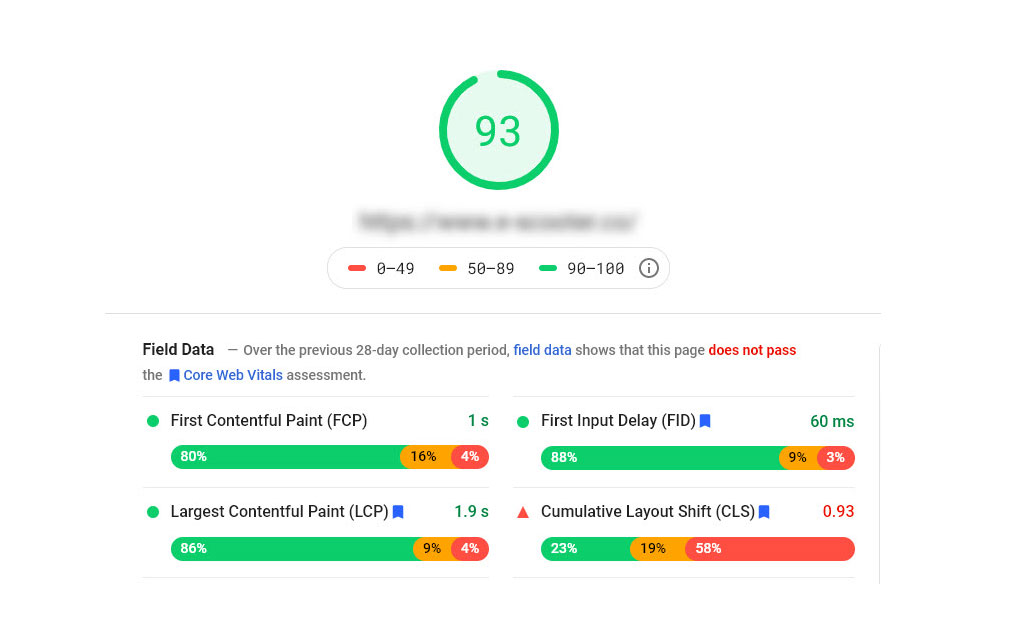
Pagespeed Insights
Pagespeed Insights is another useful tool to measure performance metrics of a page, with both a lab and a real world page experience score. You can test the mobile friendliness or desktop version of your site all in one place. User experience metrics can now be broken down by using the Pagespeed Insights tool, which will analyse the content of a page and offer recommendations on how to improve performance when trying to optimise for this ranking signal. Keep in mind that field data will only show if there is enough real world data available for the site (collected from users who anonymously opt in to Googles sample pool).
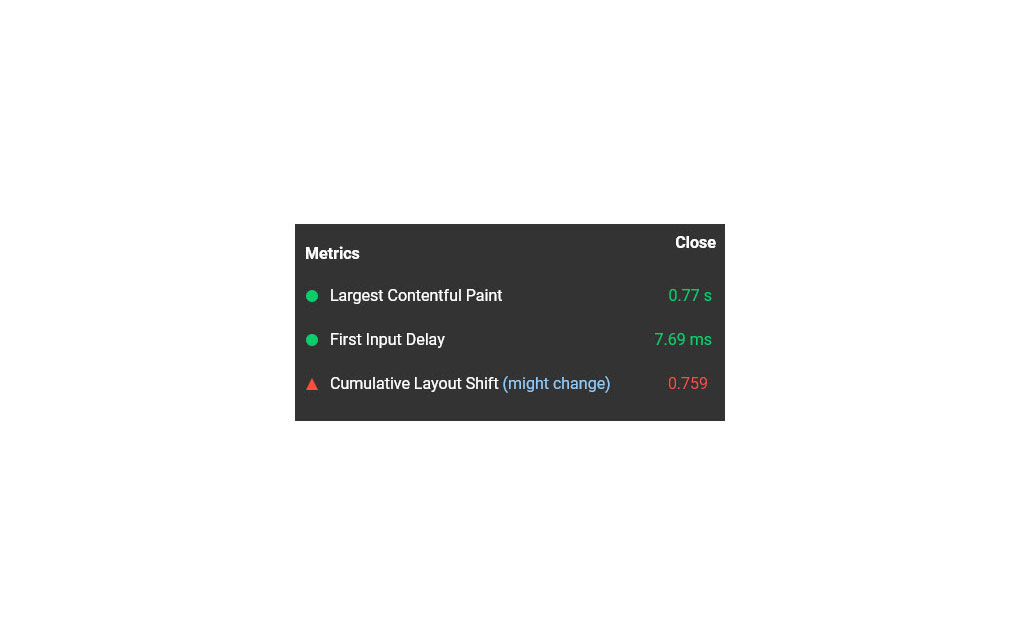
Web Vitals Extension
The newest way to measure page experience is now available in a browser extension called Web Vitals extension, and it covers the three Core Web Vitals: largest Contentful Paint, First Input Delay and Cumulative Layout Shift. You can find it in the Chrome Web Store here. After installing it, it will measure the page loading time or any other part of the site that you click as you browse through pages. Any poor URLs will be measured in real time so that you can see which pages need improvement as you browse.
Core Web Vitals: Lab data vs field data
When measuring your page performance, it’s important to note that there are two data sets that can be found across the tools:
Lab data, which you can find when using Lighthouse, replicates performance data in an environment which is controlled using predefined network and device settings. This allows for more consistent results, which is important when debugging UX issues. Lab data measures all web vitals, but cannot be measured against real world KPI’s, given the diverse array of device types and connections that are found in the wild. It uses a scoring calculator with a weighted average of metrics between the Core Web Vitals
Field data or real user monitoring (RUM) measures the true user experience from actual page loads. Using tools powered by the CrUX report, you can gather Core Web Vitals metrics from your users, but there are limitations when it comes to monitoring RUM, and it is harder to debug these issues when they appear.
So depending on whether a user is sitting at home and connected to their lighting fast broadband or connected to their mobile phone’s data plan and roaming, RUM metrics will change on a regular basis, so keep this in mind when running these reports. If you notice an influx of new errors in search console, try to correlate the dates against any new releases that may have gone live on your site and use another tool such as Lighthouse or Pagespeed Insights (which offers both field and lab data) to troubleshoot the problem pages.
How to improve Core Web Vitals?
There is no better time to start optimising for this ranking signal than now, so once you have familiarized yourself with the different reports and found some poor URLs or noticed an unexpected layout shift, it’s time to get busy! First off, you need to make sure that your site:
- Has no intrusive ads – Google does not like websites that bombard the user with an overwhelming amount of pop-ups or interstitial ads, so be wearing of this. If you are part of Google AdSense, then you should follow the strict guidelines.
- Is mobile friendly – the majority of search queries are carried out on mobile devices, so the mobile friendliness of websites is a very important factor – Google developed AMP (accelerated mobile pages)in an attempt to embrace this trend.
- Is safe to browse – in a nutshell, Google does not want websites with malware or any other type of malicious code to rank on the first page of the search results. Unfortunately, websites do get hacked and injected with such code, so make sure your site is maintained regularly – a lot of these exploits rise from CMSs that have not been updated.
- Has HTTPS – protect the privacy of your users with an SSL certificate from the moment you start working on your domain and redirect any http versions of the website to HTTPS (avoiding duplicated content issues, broken links, etc.)
Most website’s have the above in check, but it’s worth mentioning – the new addition to the ranking factor list will be core webs vitals. Depending on your level of experience and the web vital that you are trying to optimise for, it might be a complicated journey but understanding the Core Web Vitals is important and a good place to start. We can begin by looking at the largest contentful paint.
How to optimise for LCP?
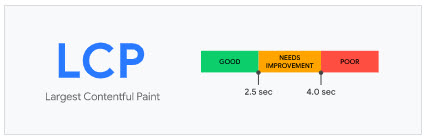
Before Google introduced the Core Web Vitals, it was hard for developers to work out how long it would take for the main content on a page to become visible for users. So Google decided to take the largest element found on a page and measure the speed it took to load in the view port, and named this metric the largest contentful paint. Good LCP measures in under 2.5 seconds, anything between 2.5 and 4 seconds needs improving, and load times over 4s are considered poor.
What elements are considered for LCP?
There are a few webpage elements that are taken into account when measuring largest contentful paint, and these are:
- image elements <img>
- <image> elements found inside an <svg> element (SVG or scalable vector graphics elements)
- <video> elements, the poster image is used here
- elements with a background image that is loaded with URL() instead of a CSS gradient
- block level elements that contain text nodes
What causes slow LCP?
There are four common factors that usually affect LCP load time:
- Client side rendering – many sites are built using JavaScript, which then render the page directly in the browser for each user that loads a page. Unfortunately, JavaScript has a big impact on page loads times and any critical rendering needs to be completed first before anything else can execute, slowing down the time it takes for content to be made visible.
- Render blocking JavaScript or CSS – any additional third party plugins or extensions greatly affect load times. Consider using only the bare minimum, plugins add JavaScript and CSS that you can maybe do without. Chatbots or live chat windows that popup also slow things down.
- Resource load times – any elements that render above the fold such as images, video or text blocks will affect this score. Hero banners are a usual culprit, these need to optimised for performance.
- Slow server response times – if a server is slow it affects all page speed metrics and will greatly reduce the impact of any other SEO work that is carried out
Every website is going to respond differently and have its own LCP, there is no one size fits all solution and unlike some other aspects of SEO that can be optimised with the help of a plugin or extension, Core Web Vitals need to be looked at individually and in most cases fixed by a developer. A good place to start is Web.dev, a hub for developers who are working on web vitals. Next, we will look at first input delay.
How to optimise for FID?
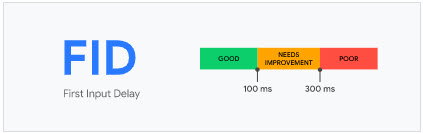
How often have you clicked a button on a page or tried navigating around a website and had to wait for it to respond and then load? This dwell time is called First Input Delay (FID) and is now considered part of the Core Web Vitals. Measuring when a user first interacts with the page and how long the response time is, FID puts an emphasis on the interactivity of webpages but is only measured if a user has an actual interaction, making it a field metric.
What causes FID?
In the majority of cases out there, the main cause for poor first input delay is going to be heavy JavaScript execution. The more scripts you have, the busier the main thread will be, causing delays and increasing the total blocking time (TBT) which means that the web browser can’t respond when users try to interact with the site.
Optimising JavaScript for FID
There are a few different aspects to take into account when executing JavaScript:
- Use a web worker – web workers allow sites to execute JavaScript though different threads so that they don’t block the user interface. This is one of the best ways to free up your main thread and improve response times.
- Break up long tasks – scripts that take long to load can sometimes be broken down into smaller, asynchronous tasks. Anything longer than 50ms is considered a long task.
- Reduce JavaScript execution times – try to limit the amount of JavaScript that is used, reducing this will improve browser response times
- Optimise pages for Interaction Readiness
There are so many ways that JavaScript can affect FID – always be wearing of adding any third party plugins or extensions to your website. The Chrome User Experience report is one of the best tools to measure this web vital as it provides the exact details on which elements are causing long delays times. Other tools like Lighthouse only measure total blocking time in the lab environment, but this is still useful when troubleshooting. The best place to get started is on Web.dev. Now we will have a look at cumulative layout shift.
How to optimise for CLS?
You have probably experienced an unexpected layout shift more than once while browsing around the internet – scrolling down a page and suddenly an advert appears, and you accidentally click on it! These layout shifts disrupt the user’s experience and can be very distracting, let alone frustrating. Another common scenario often found on e-commerce sites is when a user clicks on the ‘Add to Cart’ button and the layout shifts in order to make space for the addition element coming into the view port.

What causes poor CLS scores?
There are many different causes for layout shifts, but some of the most common ones are:
- Adverts, i-frames and other imbedded content – reserving the space needed for ad slots or other imbedded content is the best way to optimise this. The responsive nature of dynamically injected adds can make this difficult to predict – historical data should guide you when making this decision. Avoid placing adverts at the top of view ports too, as this can often cause layout shifts.
- Content that is dynamically injected – try to avoid placing new content above existing content unless a user interacts with the element.
- Web fonts – when downloaded and rendered, web fonts can cause layout shifts in a couple of ways: FOUT (flash of unstyled text) and FLOUT (flash of invisible text)
- Actions that need to wait for a network response before the DOM is updated
- Images without dimensions – always include the width and height size attributes to images and video content, or reserve a space in the CSS aspect ratio boxes. Browsers need to allocate the correct amount of space needed in documents while images or videos load.
Depending on the dynamic nature of your site, optimising for CLS can be a tricky task – there shouldn’t be too many CLS errors on certain pages like informational pages or blog content, unless the site has a lot of adverts running, but e-commerce product pages commonly see layouts shifting as new products are added to cart or when the user adjusts the filter on the faceted navigation
WordPress Core Web Vitals
WordPress has released an update to the popular CMS in order to tackle some of these important page performance issues. The ‘Esperanza’ update or version 5.7 brings some much-needed improvements and is the first of four major updates planned this year, in the 5.7 update we saw:
- Gutenberg editor update – a more refined user interface making edits much easier along with numerous bug fixes.
- Lazy loading i-frames
- HTTP to HTTPS migration from the dashboard
- A new standardized colour palette
- jQuery 3.5.1 update – continual clean-up process for jQuery
- New Robots API
- Improvements to core CMS – REST API updated, new block variations, inner block API changes along with many more!
This is a great step to improving the much loved CMS that is used by bloggers and SME’s all over the world – if you have not updated your website yet, then this is a good way to start improving your Core Web Vitals. Some WordPress websites have a lot of customisations though, so be sure to check with your web developer before making any big changes such as this – but the for the majority of WordPress users there should not be any issues, only improved performance all round!
If you have updated to the latest version but are still not seeing any noticeable improvements in your page speed, then get in touch today to see how we can help you!


Let Datadial help bring your next project to life. Just get in touch today on 0208 6000 500 and ask us about:
- Developing online software
- Turning your great online idea into reality
- Automating existing processes
- Integrating disparate and legacy systems
- Building an e-commerce site
- Designing your website