

Did you know that after July 2023, your Universal Analytics property will no longer process new hits, and would eventually be inaccessible?
With less than a year (a bit longer for 360 properties) left before it gets replaced, digital marketers need to get used to the new Google Analytics 4 as soon as possible to not be taken aback by this change.
Google Analytics 4 is Google’s newest tracking tool. It’s a completely new and separate system, rather than an upgrade to Universal Analytics.
Whether you’re experienced or new to using Google’s analytics service, you should start with learning the basics to implement your tracking goals properly.
In this Google Analytics 4 tutorial, you’ll learn what GA4 is all about and how you can use it to measure traffic and engagement across your websites and apps.
Here’s an overview of what we’ll cover:
- Understanding GA4’s functions and features
- Setting up Google Analytics 4
- Creating custom events in GA4
- Exploring the pre-built reports in GA4
- Uncovering deeper insights with GA4 explorations
Let’s jump right in!
What is GA4 and Why Should You Use It?
Google Analytics 4 is the newest analytics service provided by Google. The presumption of it being an upgrade to Universal Analytics is inaccurate because GA4 is a completely different tool with its new data model.
Device support for both websites and mobile apps has also been added along with new views for reporting data. Read more on the biggest changes in Google Analytics 4 to know how GA4 changes the way we think about analytics.
With the sunset of UA approaching fast, it’s no longer a matter of deciding if GA4 is worthwhile switching to or using it in tandem with UA because eventually, it will replace UA. It will become the default property when making a Google Analytics account.
Google Analytics 4 is unlike anything you may know from your previous Google Analytics experience, but its improvements, added flexibility, and perspective on analytics will help you better understand the new digital world.
What is the Goal of GA4?
Whether your business is doing well or in a precarious situation, increasing revenue will always be one of its goals.
Aside from ensuring the quality of your service or product, one of the most effective and important ways of growing your business is to know and understand your users.
Data on your users is like gold for marketers, and the GA4 tool is the shovel that will help you get that gold. If you know what users are doing on your website, you can optimize its content to attract more of them and ultimately increase your profits.
How Google Analytics 4 Works
Working with Google Analytics 4 can be divided into three aspects: measuring, reporting, and analyzing.
Let’s dive into the first aspect, measuring, by looking at an example.
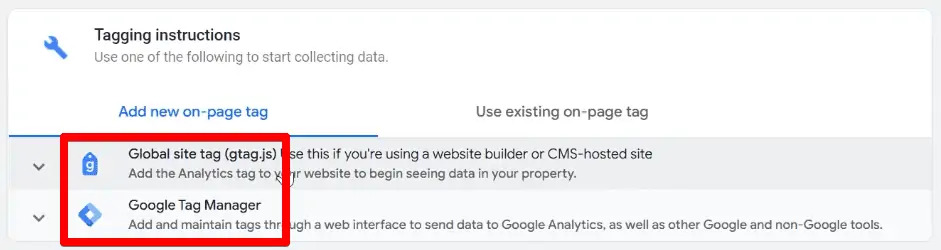
After creating an account, there are two options for implementing a snippet of code to your website. You can either use the Global site tag (gtag.js) or Google Tag Manager.
This JavaScript code will be responsible for connecting your website to Google Analytics behind the scenes. Once you have it installed, data will flow into your GA4 account.
Google Analytics 4 even allows you to check what is happening on your website in real-time.
For this step, information about your users, like where they come from, what page they are currently on, and what are they clicking on becomes data points that GA4 measures.
After measuring data about your users, the next step is reporting.
Google Analytics 4 provides multiple pre-built reports that you can use to view the data from your website and apps. Let’s look at a few of these reports!
The acquisition reports allow you to check how your users are arriving at your web page.
Data on how users interact with your web page can be seen in the engagement reports.
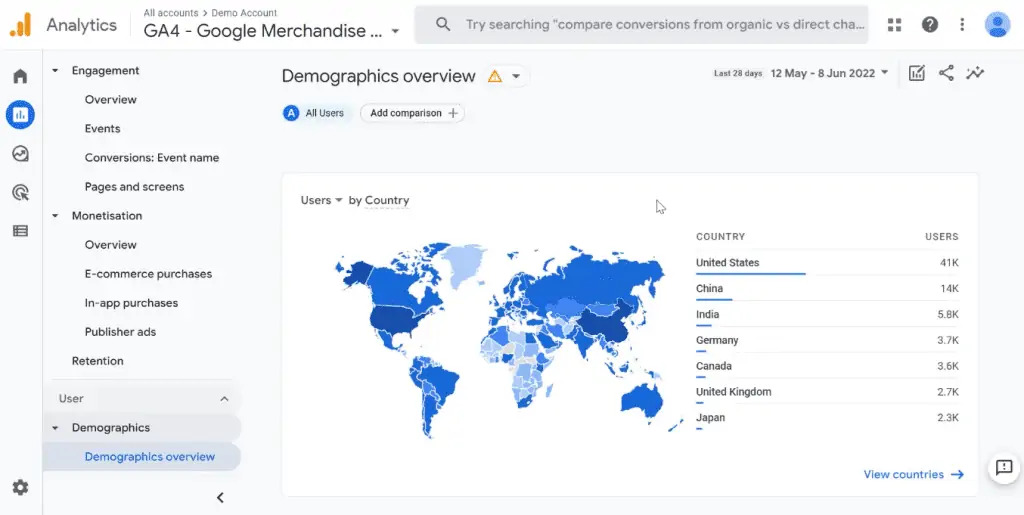
You can also see information about your users like their location, age, and interests by looking at the demographics report.
These are only some of the reports you can check out. For each category, you can still go deeper and see more specific data that might be helpful to you.
Aside from what Google provides, you can also build custom reports to view the information you care about.
While the data itself is important, the most valuable thing is to dive deeper – what can you do with this data? Well, the last aspect of the GA4 workflow, analyzing, uses the gathered data to help answer questions you may have about your users.
When you want to analyze data further, Google’s BigQuery may come to mind, especially if you’re working with a large dataset. Another way to look further is to utilize the helpful feature that comes with your GA4 property called explorations.
Explorations are a set of powerful audience discovery and comparison tools that go beyond standard reports to help you uncover deeper insights into your customers’ behavior.
There are multiple templates to choose from, each one providing you with different ways to find the answers to very specific questions about your users.
Looking at a funnel exploration example, you can see the different steps users take in making a conversion.
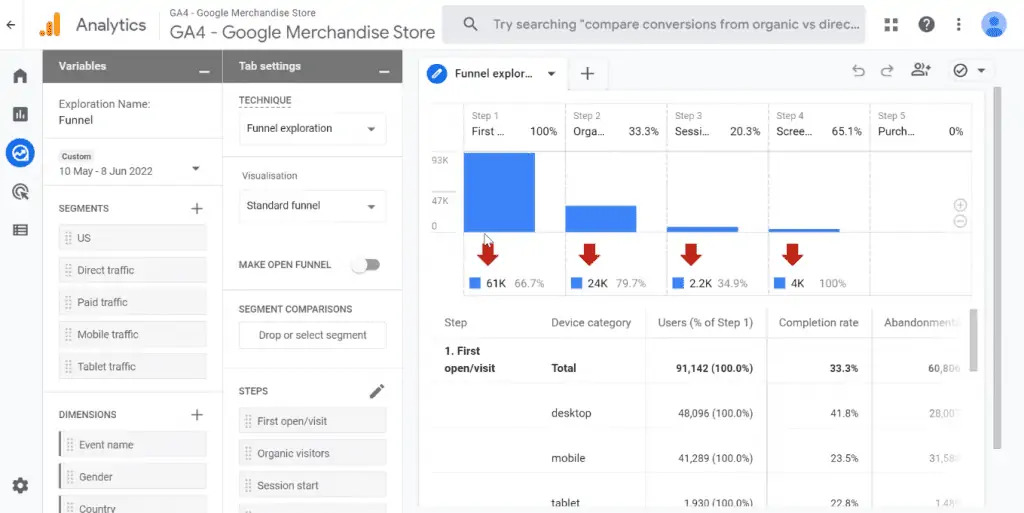
The user journey is broken down into steps and you can analyze each in detail. In the example, the user views a product, adds it to the cart, provides details, and then buys it. You can also see how many users leave at each step.
After obtaining additional information like this, the last step would be to turn those insights into actions. Maybe, you’ll start with some A/B testing or completely change the way you present your website/app content.
Whatever action you may take, GA4 is still there to let you know if those changes had a positive, negative, or inconsequential impact on your business. You can keep using this tool to optimize your content, and ultimately increase your revenue.
What we’ve covered only touches the surface of the capabilities of Google Analytics 4. It is a powerful tool that gives you valuable insights about your users simply and easily.
Now, let’s start with learning how to set up Google Analytics 4 so that you can dive deeper into its implementation.
How to Set Up Google Analytics 4
Setting up Google Analytics 4 seems deceptively easy. Simply follow the instructions Google provides, and you’re ready to start tracking different user interactions across your websites and apps.
There may be some who can handle setting up GA4 that way, but there are surely some others who can get lost with the provided instructions.
Several nuances need to be taken into consideration, and some of these steps are not as intuitive as one may think, especially for those implementing GA4 for the first time.
No need to worry as we’ll guide you through the first steps so that you can start your Google Analytics 4 journey.
Creating a GA4 Account
This section will explain the steps for creating a Google Analytics 4 account for first-time users.
Note: If you use Universal Analytics and are migrating to GA4, we have a handy GA4 migration guide that you should first check out. We have listed out all the steps you need to take, from preparation and planning to implementation and handling of data.
Since you cannot transfer historical data, the best way forward is to link the GA4 account to your existing UA property. You may not be able to access previous data in your UA property, but you will be able to import your UA tracking configuration into your GA4 property.
Check out our guide on upgrading to Google Analytics 4 to link your UA property using the GA4 Setup Assistant. Here, you’ll simultaneously create and link a GA4 account from your UA property.
Now, let’s create a new Google Analytics 4 account.
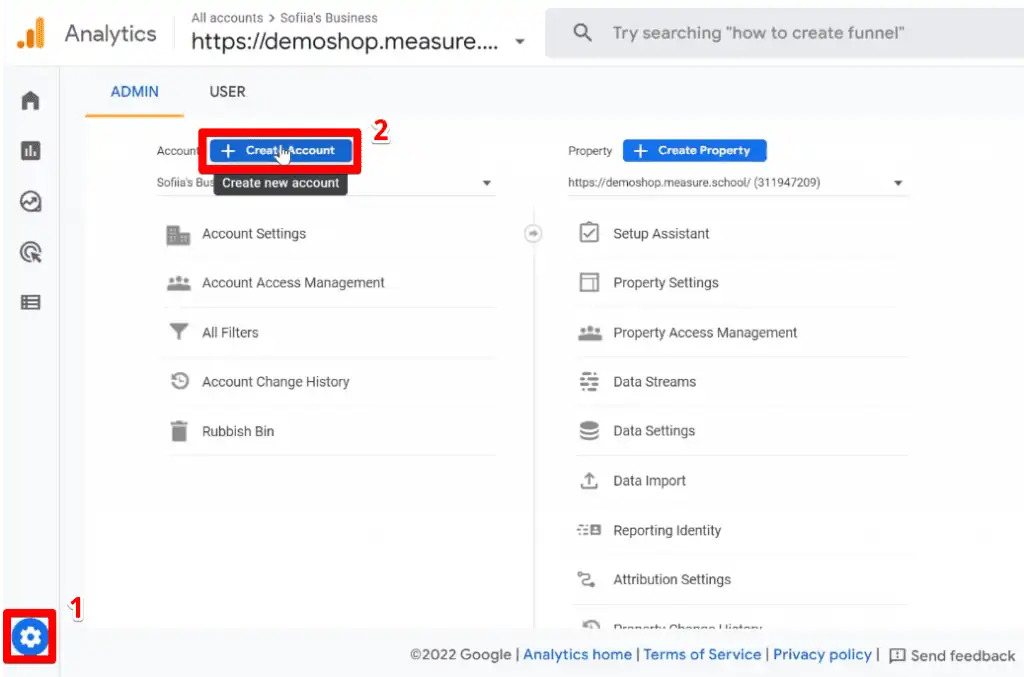
For this demo, we already have an existing account, but you can create another one from the Admin settings. If you’re using Google’s analytics services for the first time, the starting steps may be different, but you will eventually arrive at the same place.
Go to Google Analytics. Click on Admin → Create Account.
The first set of settings you need to configure is the account setup. Type in an Account name.
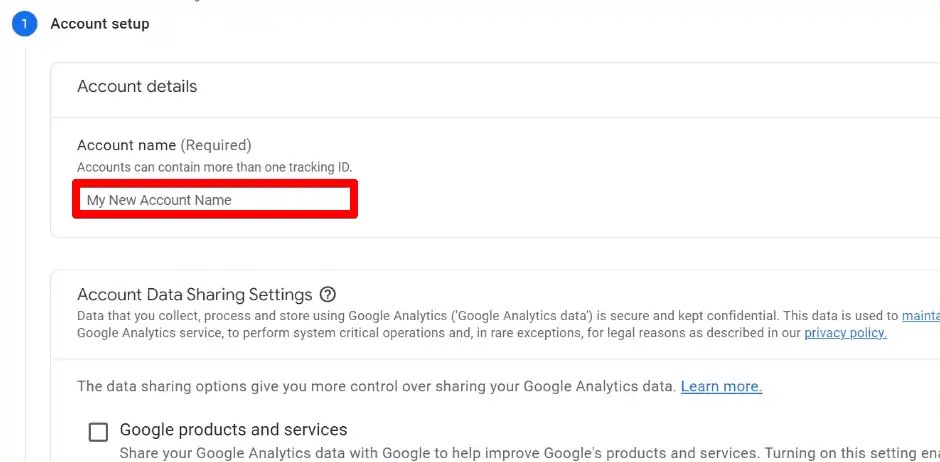
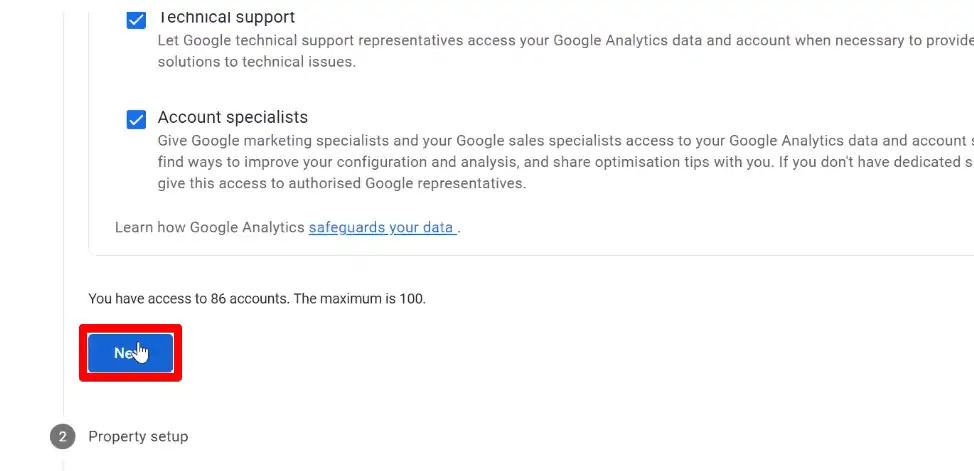
Next, you can configure the account data sharing settings.
Select the ones you choose to share. After this, click on Next to finish the account setup.
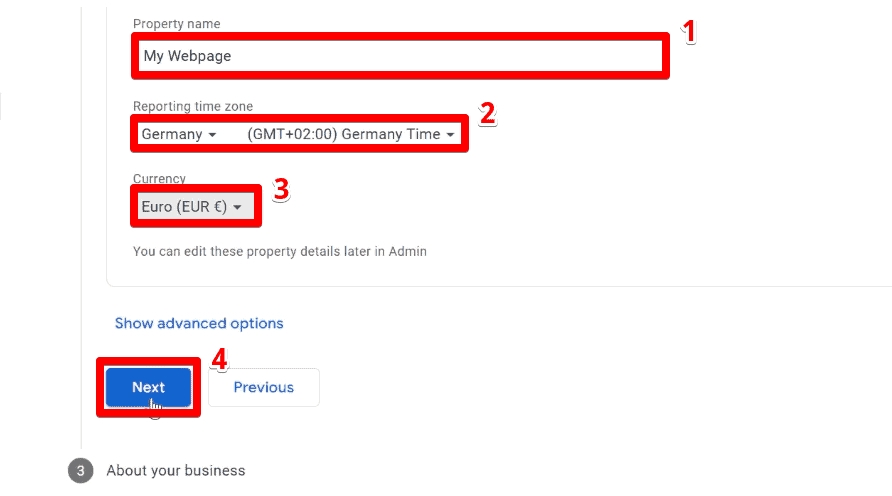
The next step is the property setup. By default, a Google Analytics 4 property will be created.
Provide a Property name, then specify the Reporting time zone and equivalent Currency. Finally, click on Next.
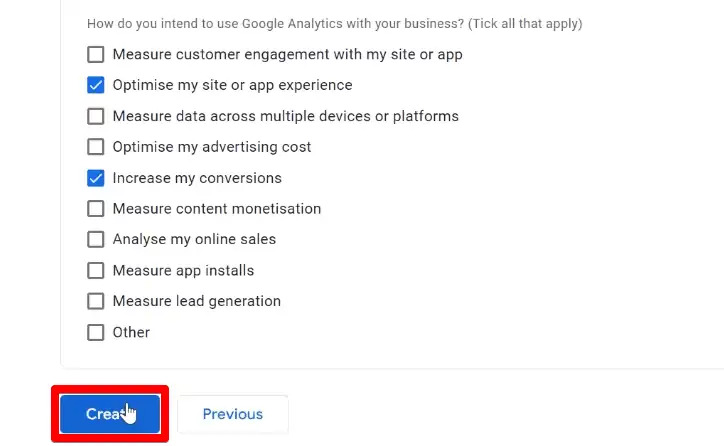
The last step in creating an account is to provide information about your business.
Tick the options that apply or skip this part if you want to. Then, click on Create.
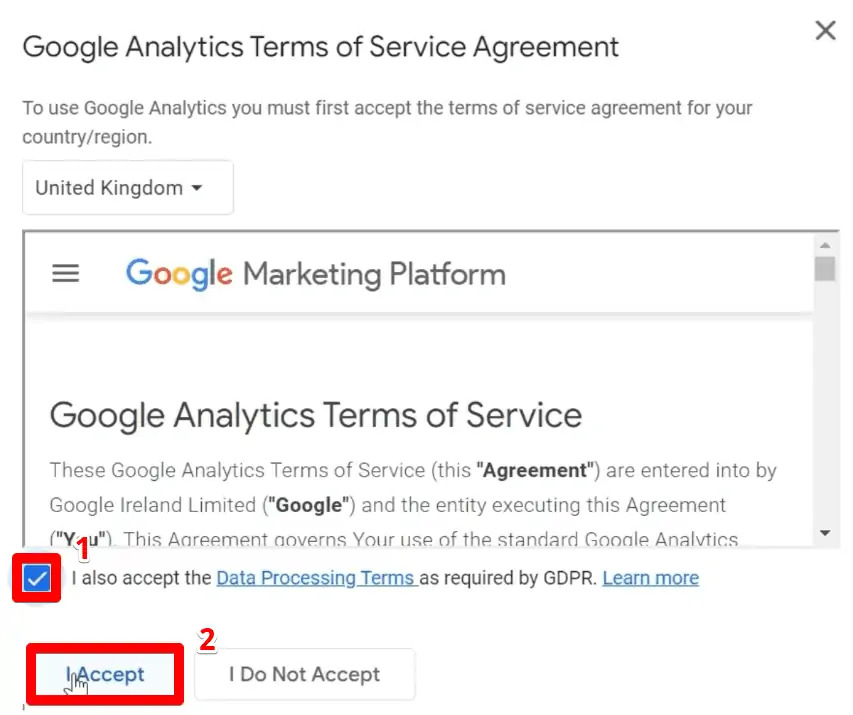
Lastly, check the box to agree to the terms of service agreement, then click on I Accept.
On your Google Analytics admin settings, there are two columns on the Account and Property settings.
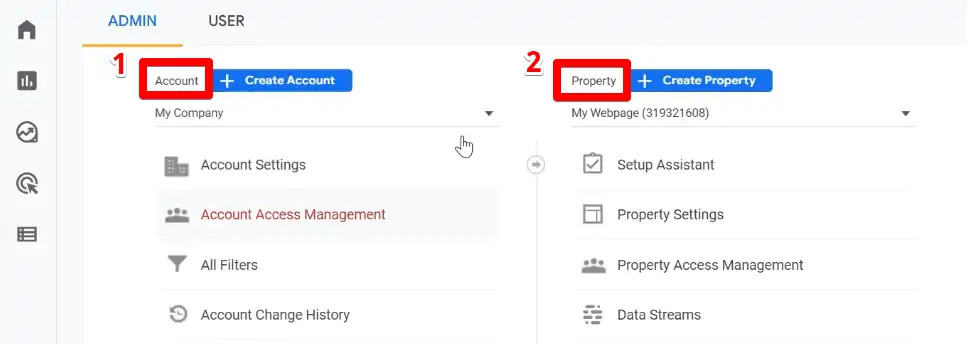
The first column contains the settings related to your account. You can also switch to other accounts from here. For a single email address, you can create up to 100 accounts.
An instance where this could make sense is when you have unrelated businesses. You can create an account for each business without logging in to a different email address.
On the other hand, the second column has the settings related to your web page or application. Similarly, you are allowed to own multiple properties in a single account, up to 50 properties for each account.
Setting up a Data Stream
Now that you have a Google Analytics account and a GA4 property, let’s set up a data stream to specify where you want to obtain data from.
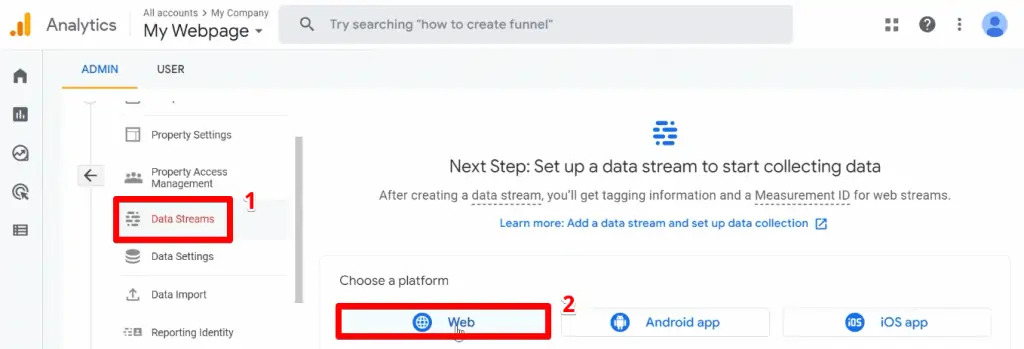
There are 3 types of data streams: Web (for websites), iOS (for iOS apps), and Android (for Android apps). We’ll be working with a web page for this demonstration, so we will use the Web data stream.
From the property settings, click on Data Streams → Web.
Enter your website URL, then provide a Stream name. Finally, click on Create stream.
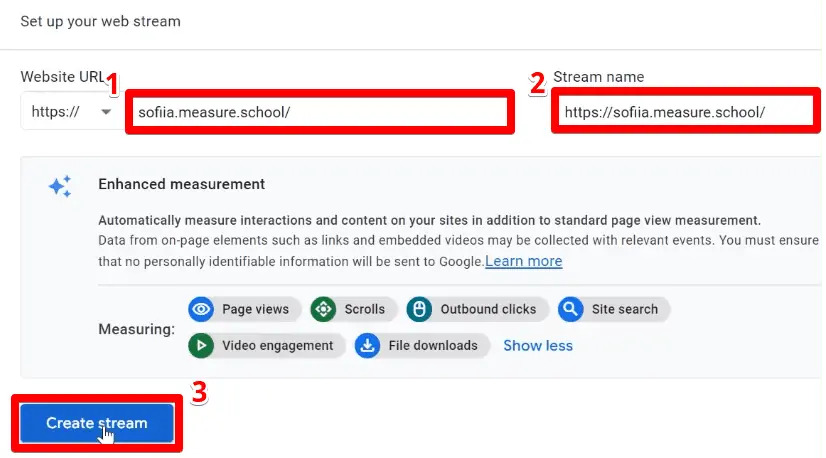
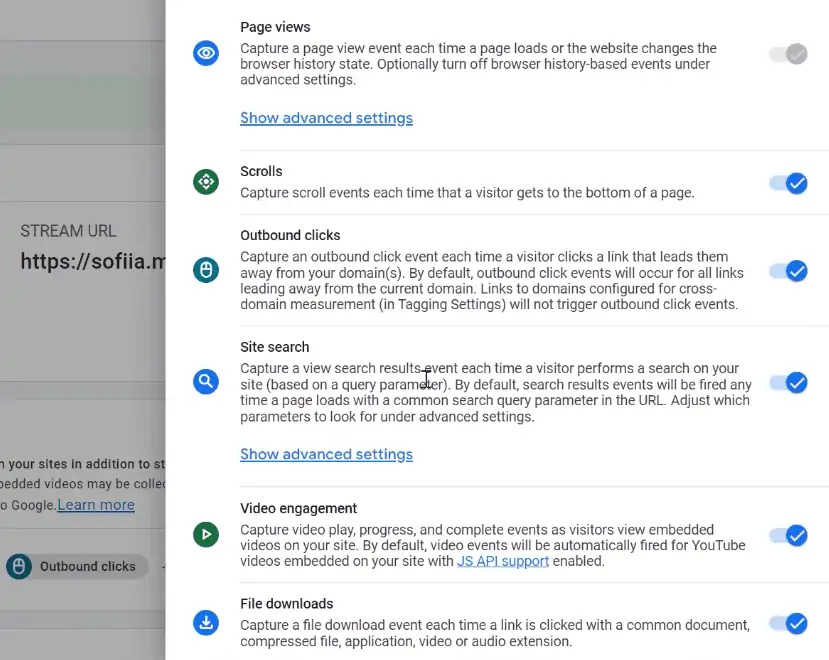
By default, enhanced measurement is activated. It allows GA4 to track some events automatically. These include pageviews, scrolls, clicks to external web pages, searches within your site, videos your users watch on your web pages, and downloads from your site.
Now that you have an account and data stream, the next step is to connect Google Analytics 4 to your website and dictate what data should be sent.
Connecting GA4 to your Web Page with GTM
As mentioned in the GA4 overview earlier, there are two ways of implementing GA4 on your website – using the Global site tag (gtag.js) or Google Tag Manager.
We’ll use GTM as it gives more flexibility when it comes to tracking.
Before proceeding, ensure that GTM is set up and properly connected to your web page. If you don’t have a GTM account yet, check out our Google Tag Manager tutorial to install GTM on your website.
First, copy the Measurement ID from the web stream details.
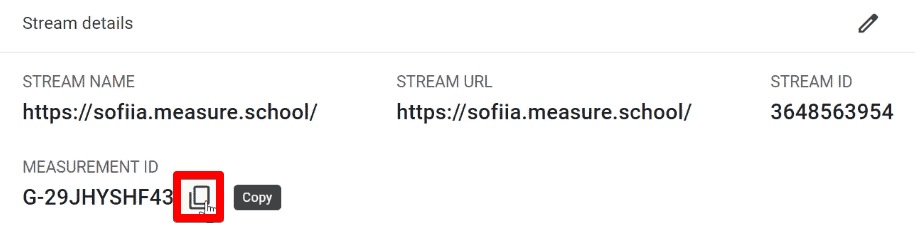
The measurement ID will help Google Analytics know that data should flow to this specific property and stream.
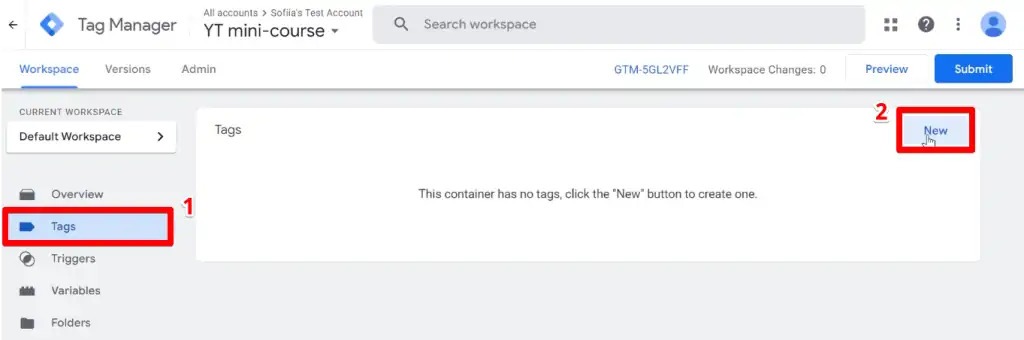
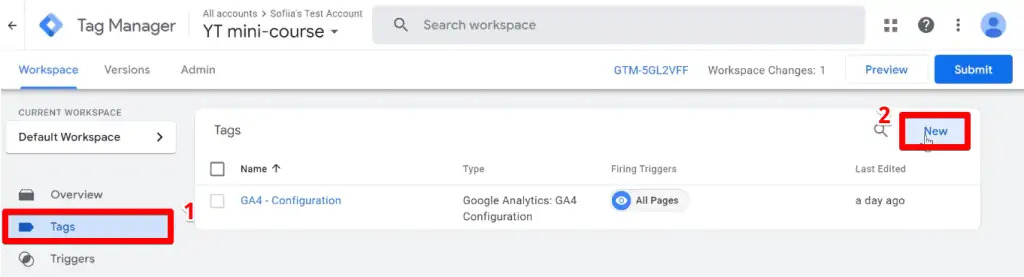
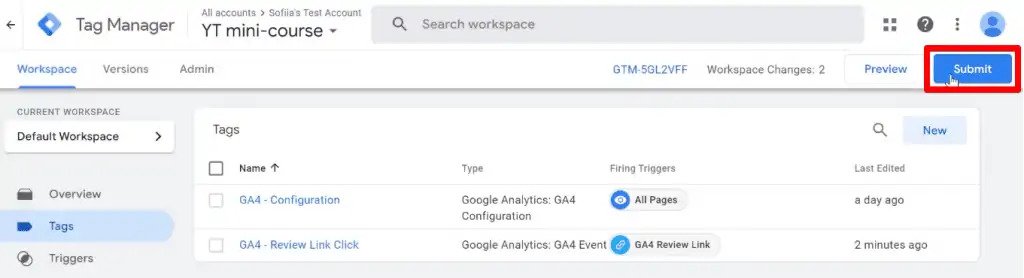
In Google Tag Manager, go to Tags → New.
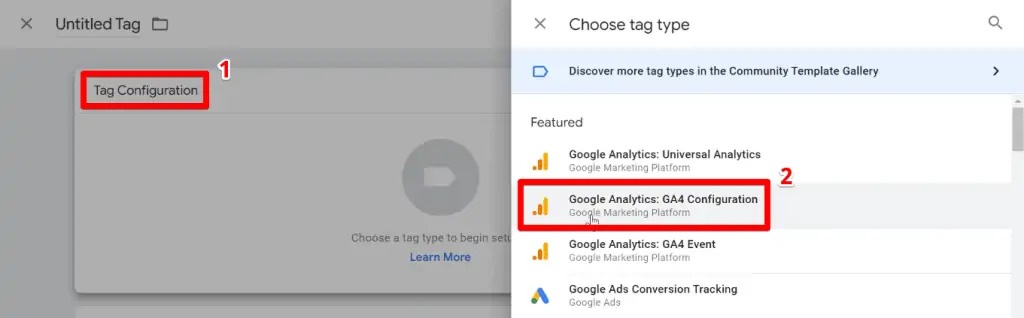
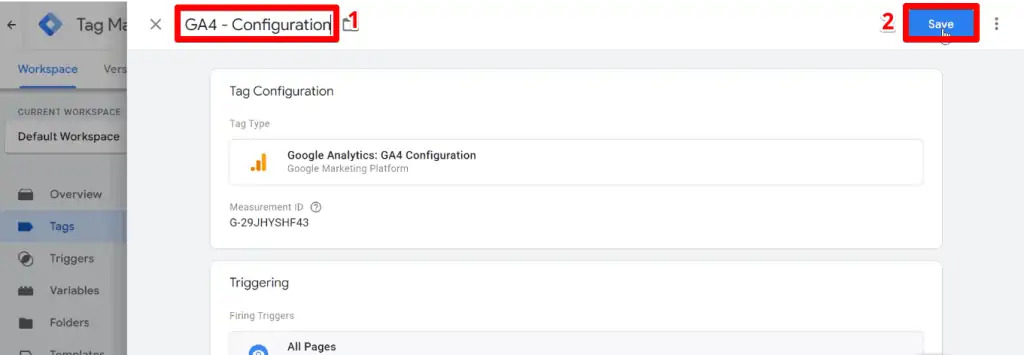
Click on Tag Configuration → Google Analytics: GA4 Configuration.
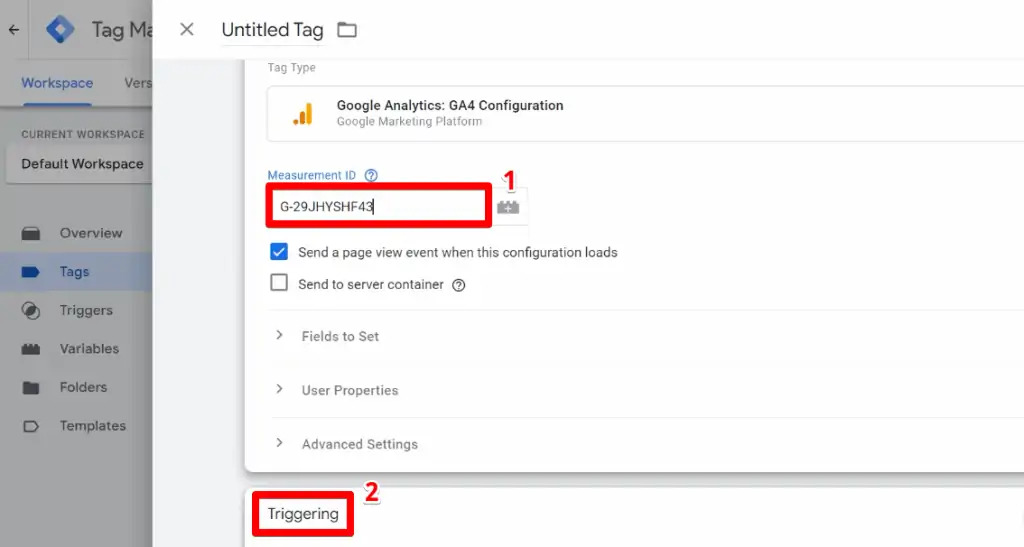
Paste the measurement ID in the space provided, then click on Triggering.
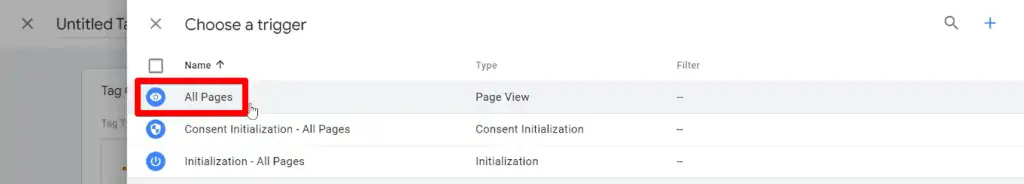
Select the All Pages trigger.
Provide a name for the tag, then click on Save.
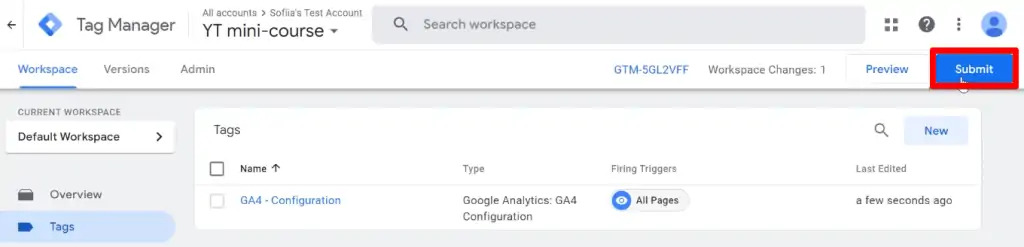
Click on Submit to make the changes live.
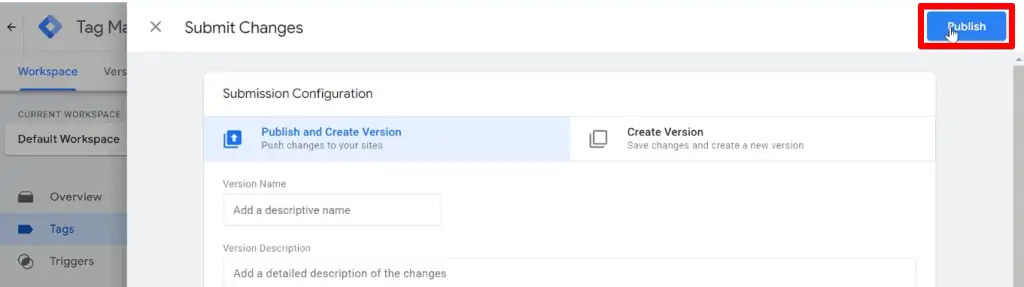
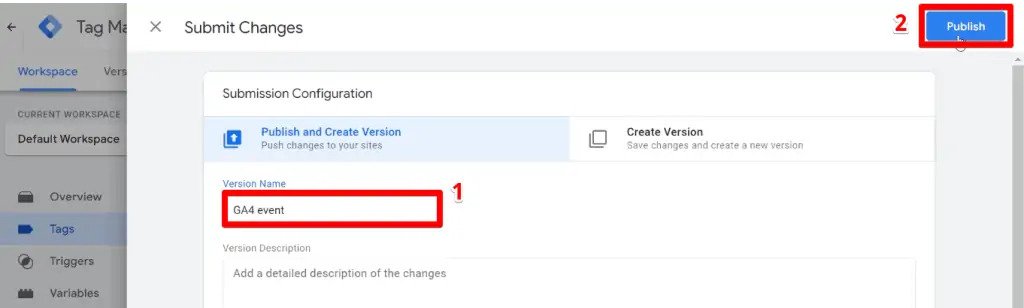
Click on Publish.
Now go to your website and refresh the page.
Using the Tag Assistant Chrome extension, you can see the global site tag on the tag analysis. This means that you have successfully implemented Google Analytics 4 on your website.
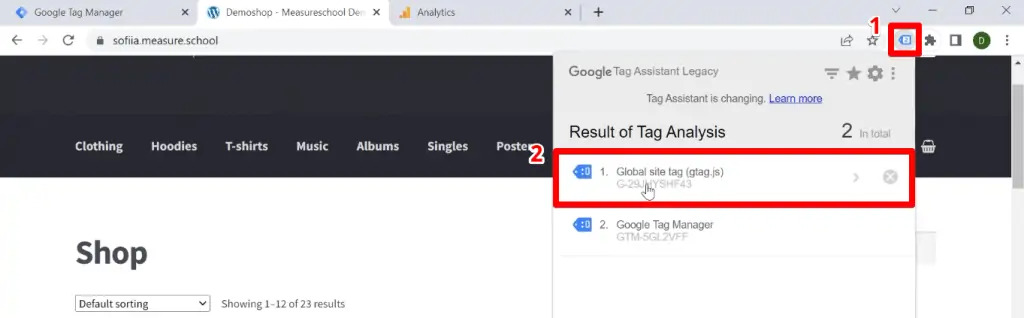
The Tag Assistant extension gives you a quick and easy way to gain insights from Google Tag Manager. Check out our list of the essential analytics Chrome extensions to know about other helpful extensions you should use to work smarter with Google Analytics.
While the GA4 global site tag showing in the Tag Assistant extension is already a good sign, checking Google Analytics is the definitive way to check if GA4 has been implemented correctly.
Go to Reports → Real-time. Here, you can see that our session has been recorded and we have been considered the first user on the web page.
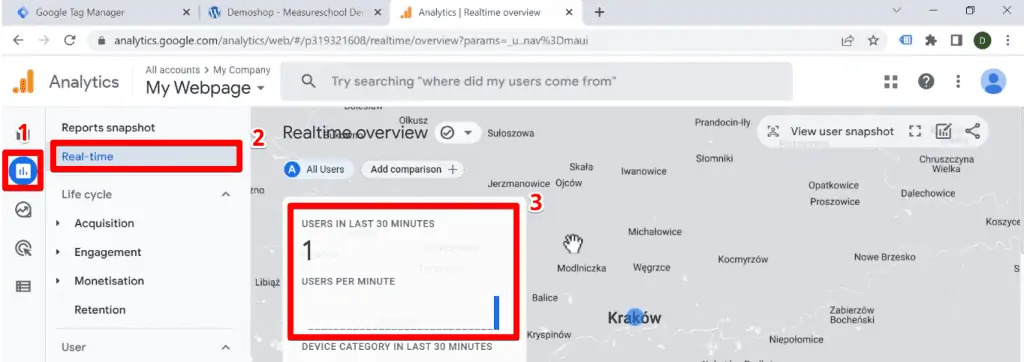
Google Analytics 4 is running properly and data is flowing into your account.
To ensure that your setup is efficient, check out our guide on GA4 audit: questions to ensure correct account setup.
How to Create GA4 Events with GTM
When Google Analytics 4 was introduced, it was announced as an event-based analytics tool where everything can be considered an event.
This provided more versatility as you could now decide if a pageview, purchase, or any other action taken by a visitor on your website was something you are interested in tracking.
Creating and tracking GA4 events has been made simple with the help of Google Tag Manager. Before making your custom event, let’s first determine the differences between GA4 event types.
GA4 Event Types
There are four event types in Google Analytics 4. Two types are collected automatically and the other two require some implementation to see them in Analytics.
Automatically collected events are the basic events that come together with your snippet. Google Analytics collects them by default when you set up Google Analytics 4 on your website or app.
Next, we have the enhanced measurement events, which were briefly covered while setting up a data stream.
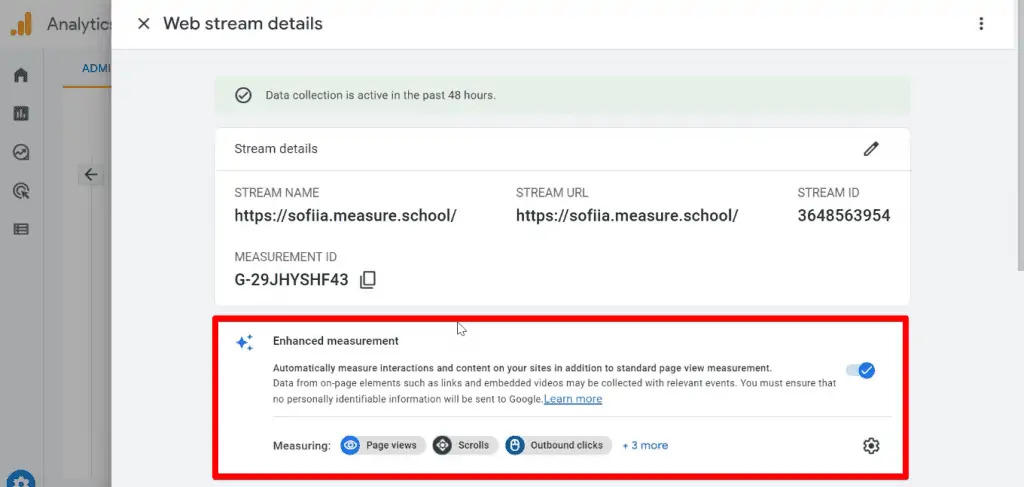
You can toggle the entire enhanced measurement events collection on or off by accessing the stream details on your GA4 property.
To select which specific events you wish to track, click on the gear icon at the bottom right.
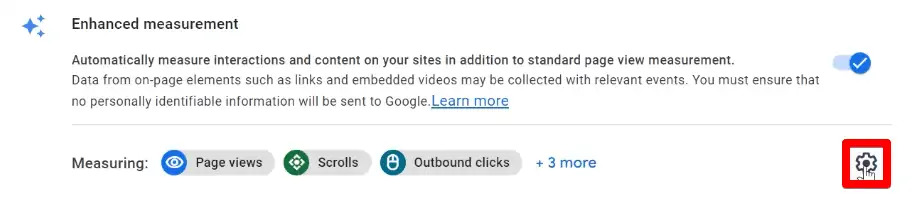
Here, you are given a full description of each event under this event type and the ability to specify which events you wish to track.
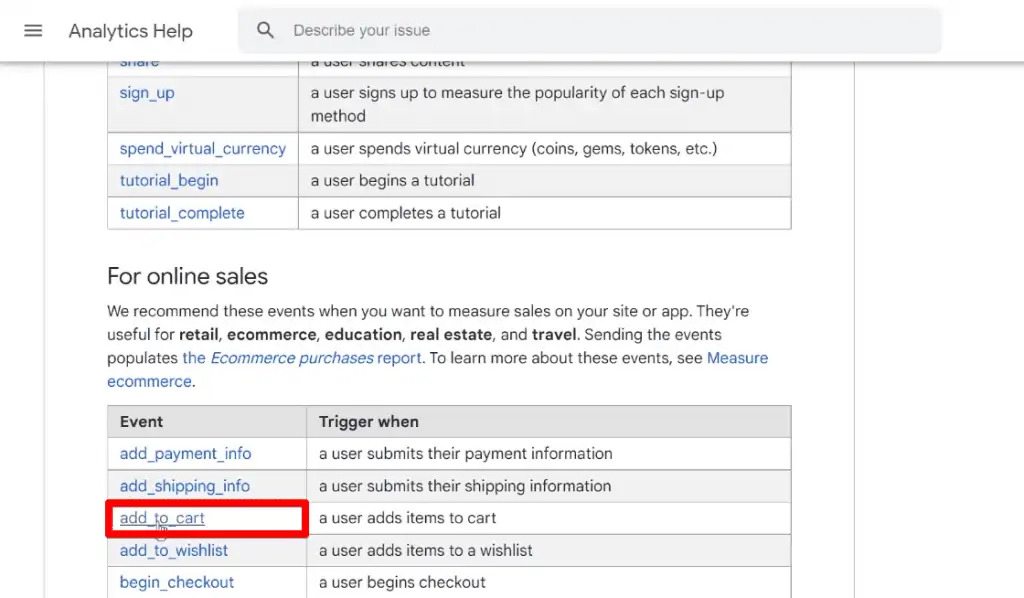
Next, we have the recommended events. These are the events that you implement but have predetermined names and parameters.
If you have an event you wish to track, it is recommended to first check the recommended events article provided in the Analytics Help to unlock reporting capabilities. Here, you will find the predetermined names and links describing the prescribed parameters for each event.
For example, if we want to track an add-to-cart event, click on the add_to_cart link in the For online sales section of the article.
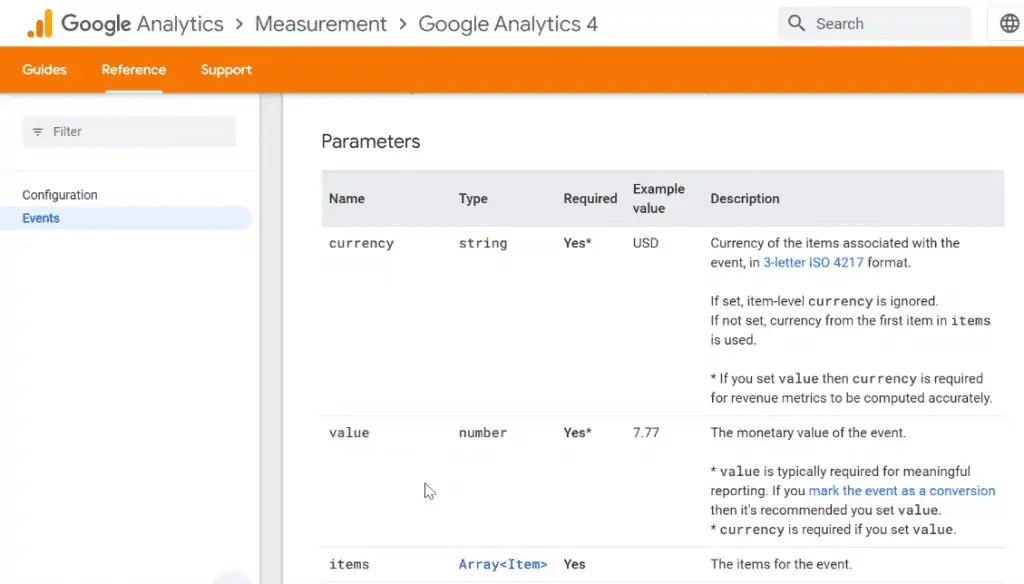
This link leads you to a Google Analytics developers page where the prescribed parameters are listed and explained in great detail. These parameters are additional data points that help describe the event.
The last event type is the custom events. These are the events that you define. If you’re trying to track an event that is not on the list of recommended events, you can implement a custom one with your own corresponding set of parameters.
Note that these custom events will not appear in most standard reports, so you will need to set up custom reports or explorations for a meaningful analysis.
Implementing a Custom Event in GA4 with GTM
Let’s create a custom event in Google Analytics 4 with the help of Google Tag Manager.
First, determine what event you want to track.
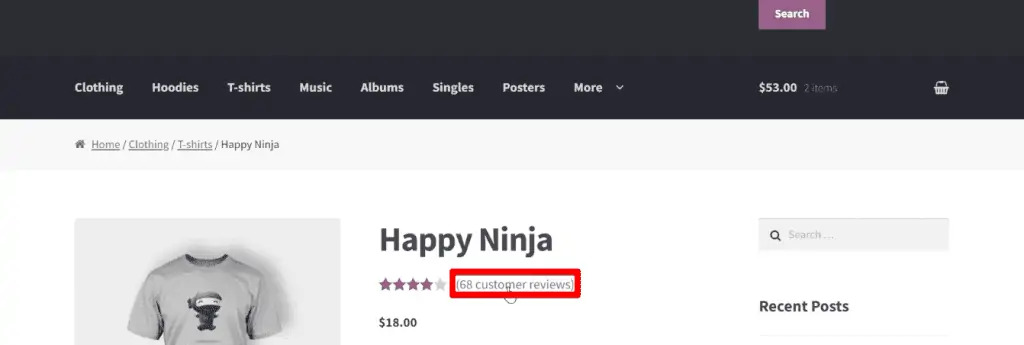
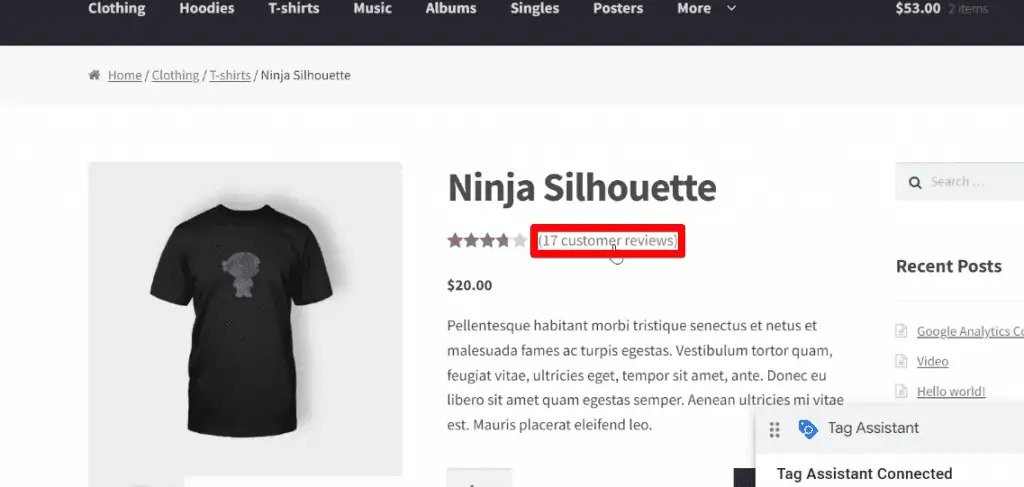
For this example, let’s track a specific link that redirects the user to a web page with reviews for the product.
Before any implementation, go to Variables and ensure that all click variables are activated.
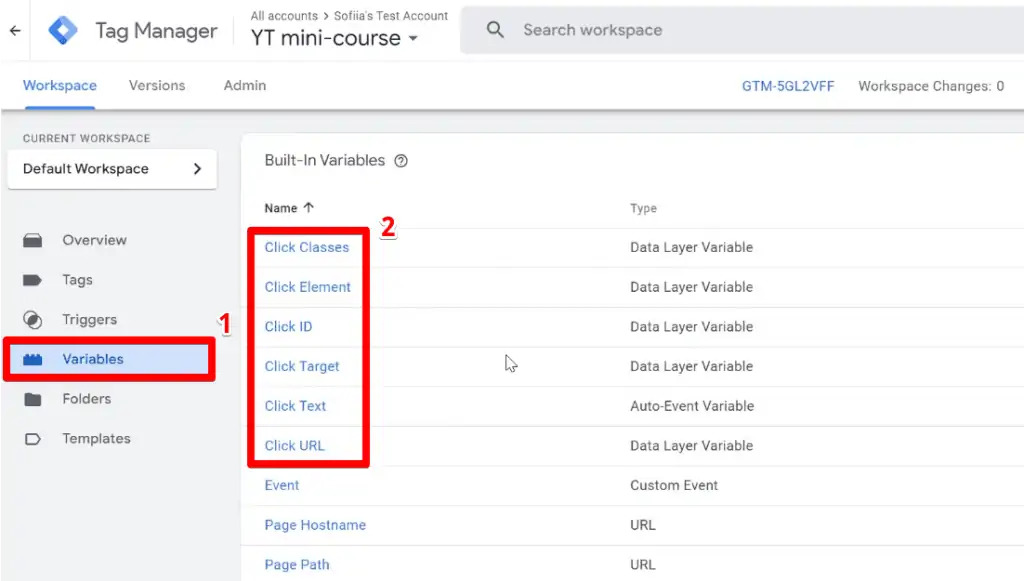
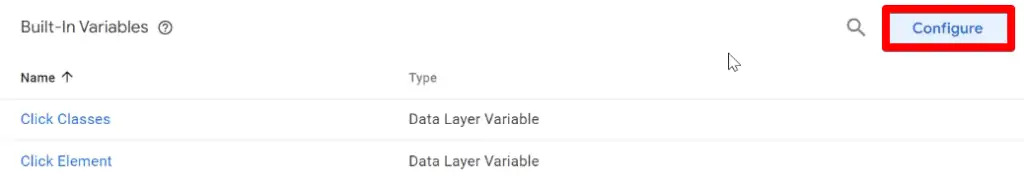
If your click variables are not yet activated, click on Configure and select all click variables.
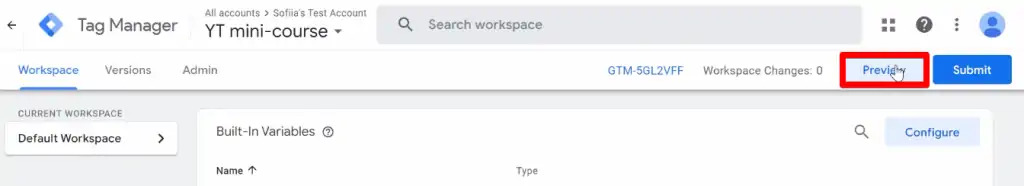
Now, let’s click on Preview.
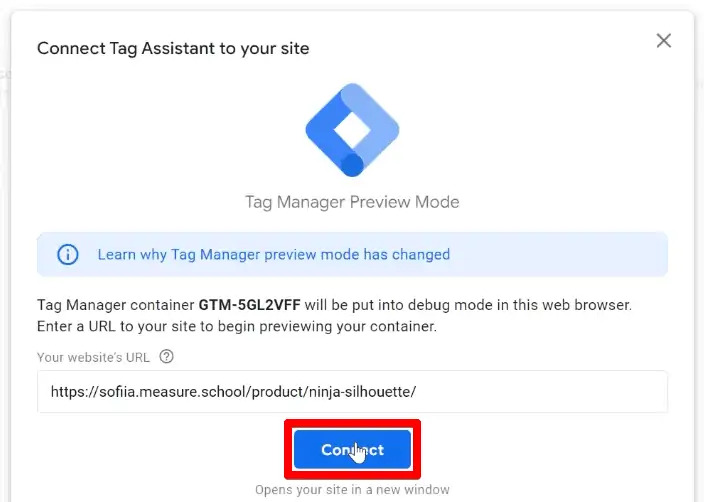
Click on Connect.
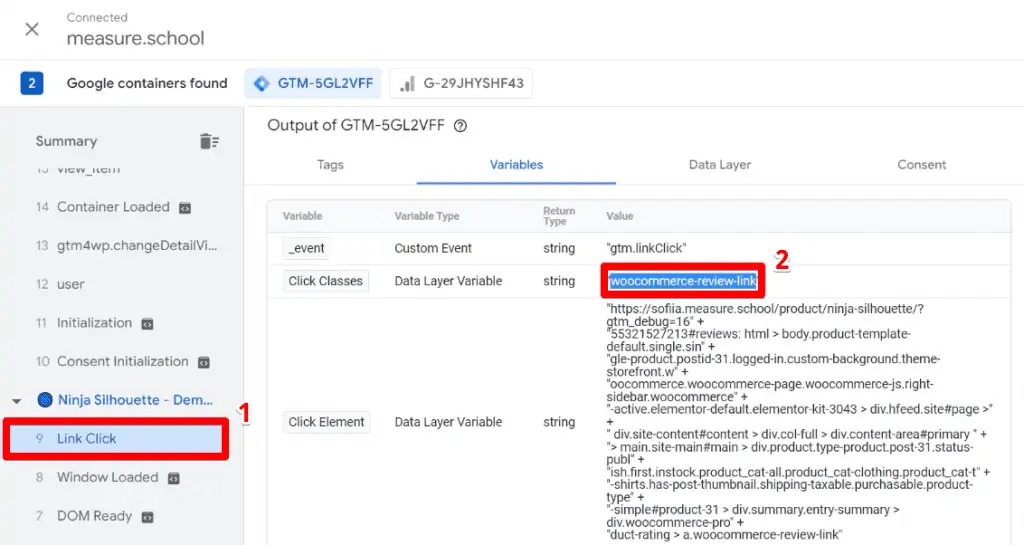
On the tab connected to the Tag Assistant, click on the link you want to track.

Go to the Tag Assistant and select Link Click. Since this example is aimed at tracking link clicks for all reviews, the click classes variable is the most appropriate for the tag. Copy this value.
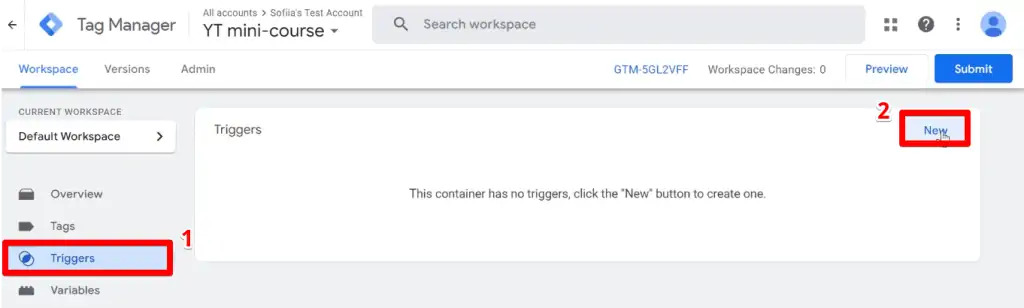
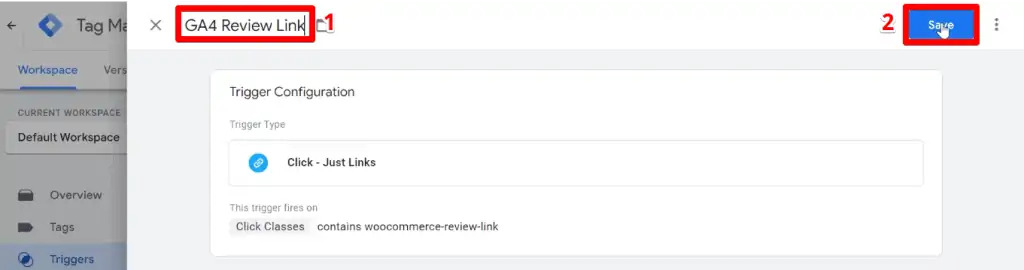
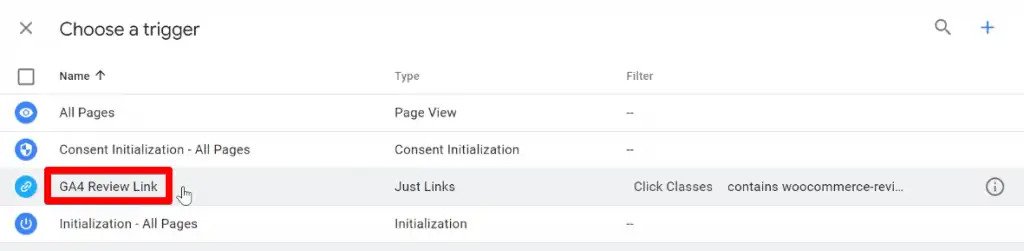
Going back to Tag Manager, click on Triggers → New.
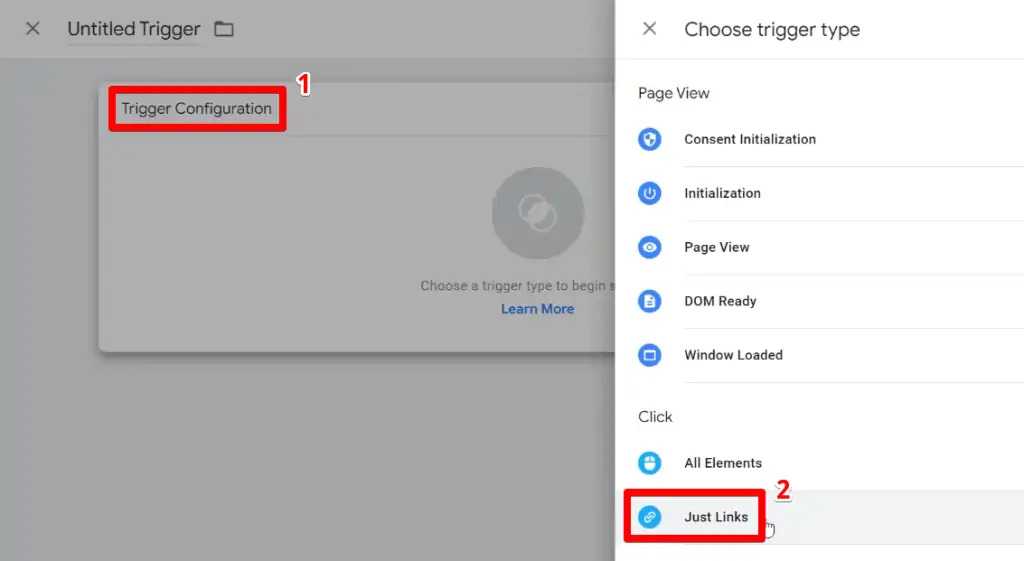
Click on Trigger Configuration → Just Links.
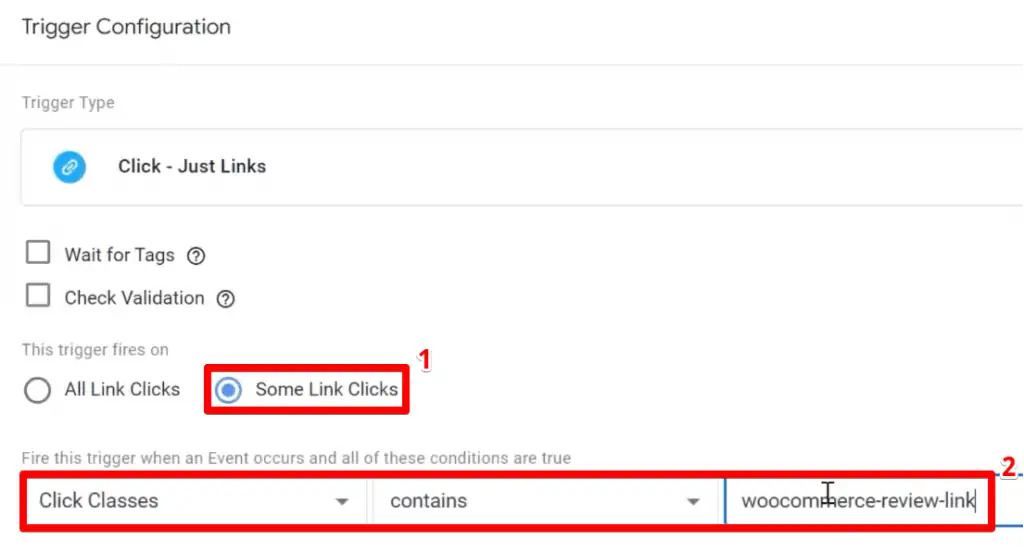
We only want to track a specific link, so select Some Link Clicks. Specify the condition as Click Classes contains as the click classes value.
Provide a name for the trigger, then click on Save.
Now, you can create a tag for your custom event.
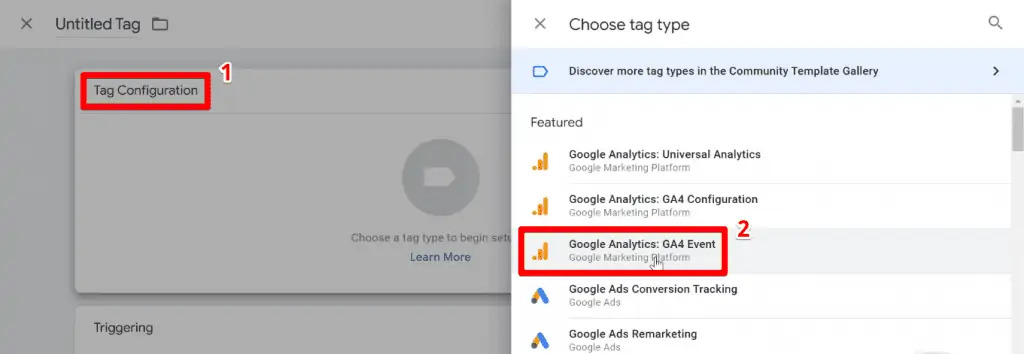
Go to Tags → New.
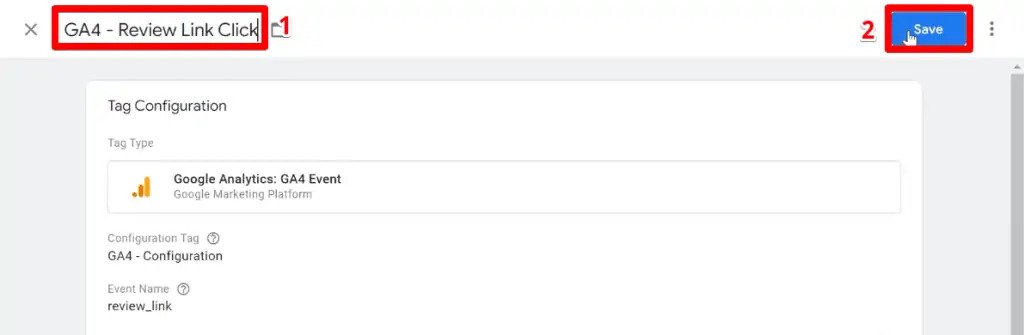
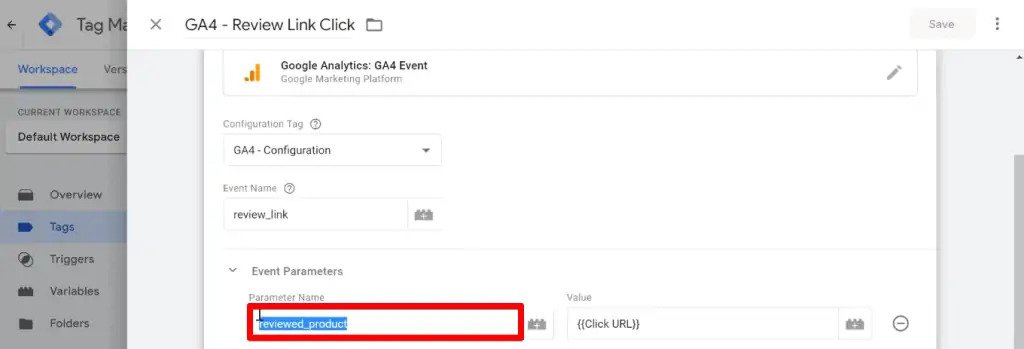
Click on Tag Configuration → Google Analytics: GA4 Event.
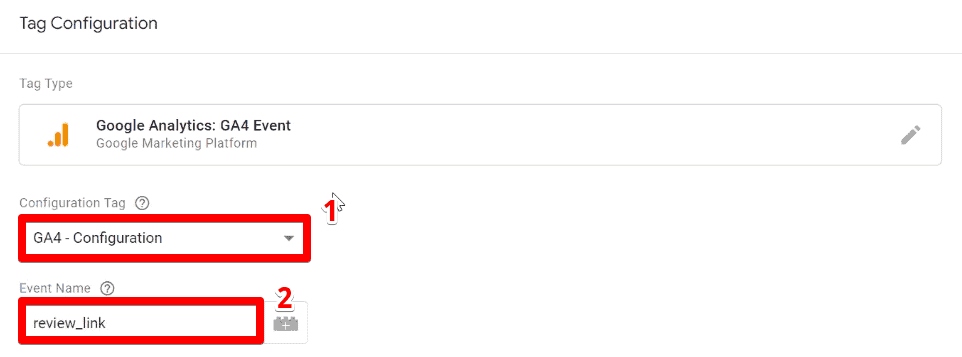
Select the GA4 configuration tag you have previously set up, then provide an event name.
Next, click on Event Parameters → Add Row.
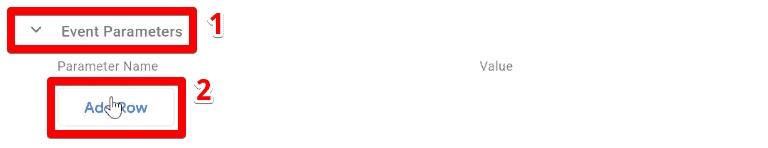
Provide a parameter name, then click on the lego piece icon under the value.
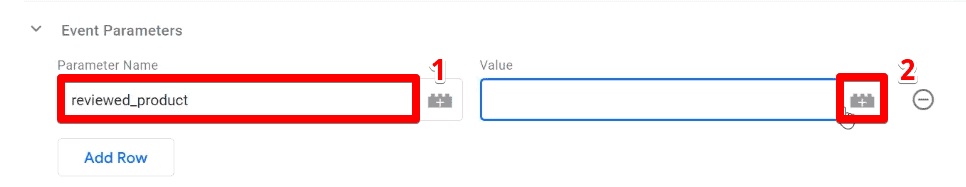
Select the Click URL variable.
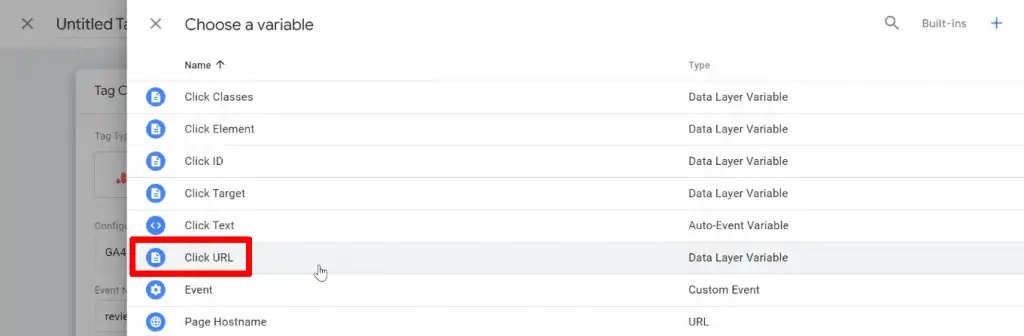
Next, click on Triggering.
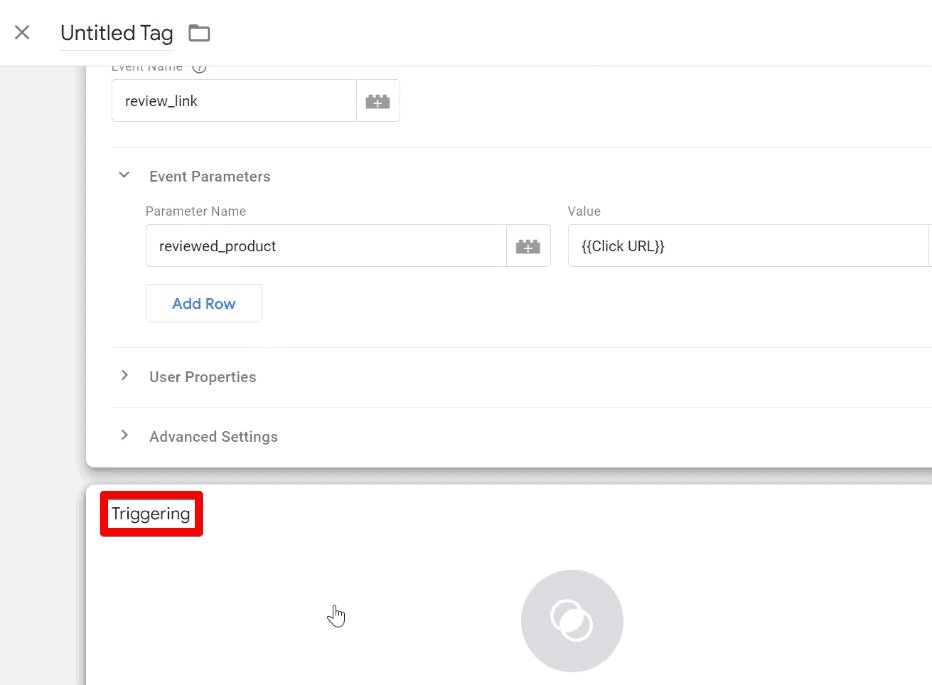
Select the custom trigger you created for the custom link clicks.
Finally, select a tag name and click on Save.
Selecting the right trigger and parameters for your custom events depends on the action you want to track. Our guide on button click tracking with GTM may be helpful for some of your custom events.
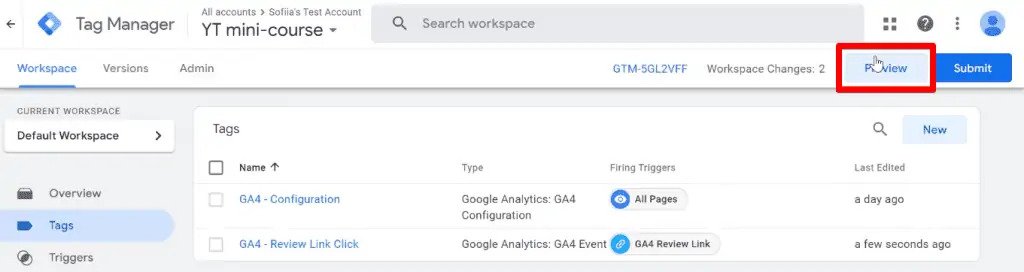
Now, let’s test our tag.
Click on Preview again.
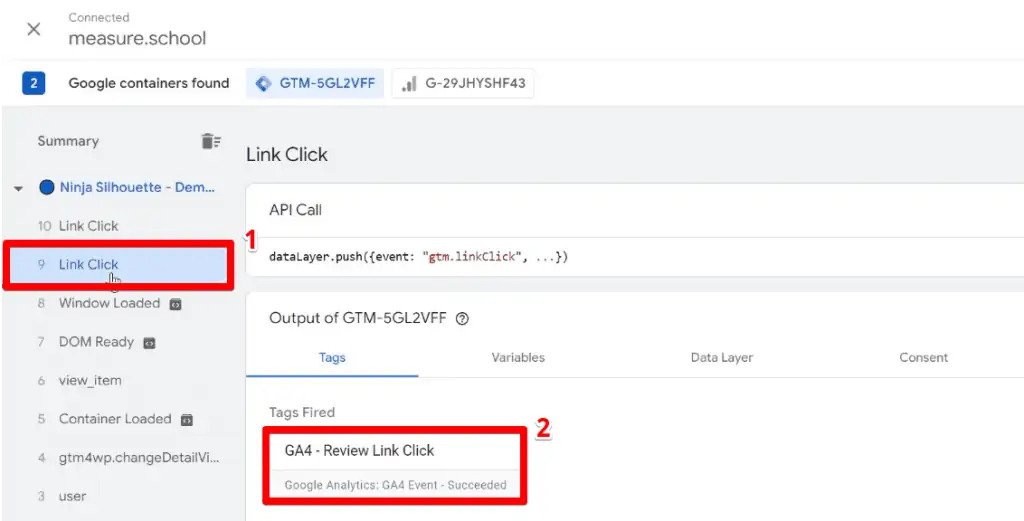
On the website connected to Tag Assistant, click on the review link again.
In Tag Assistant, you can see under the Link Click event that your custom event tag has been fired.
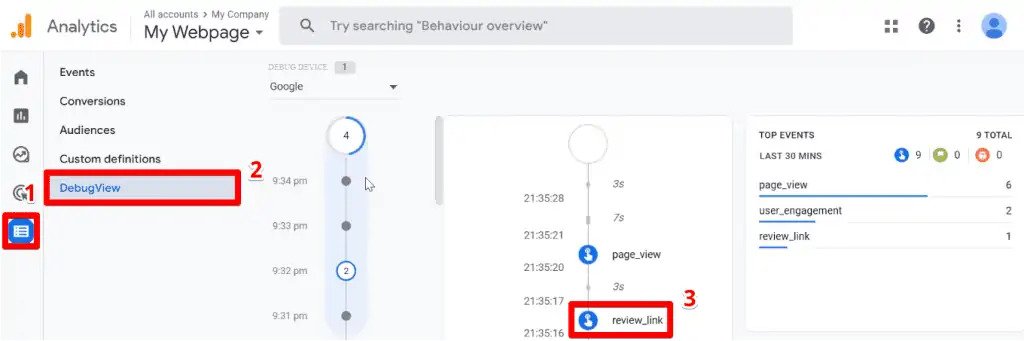
Let’s check if it has been recorded in Google Analytics.
Go to Configure → DebugView. Here, you can see your review_link event. This means that your tracking has been set up correctly.
Clicking on your custom event allows you to see the parameters you are sending along with this event. Here, you can see your reviewed_product parameter.
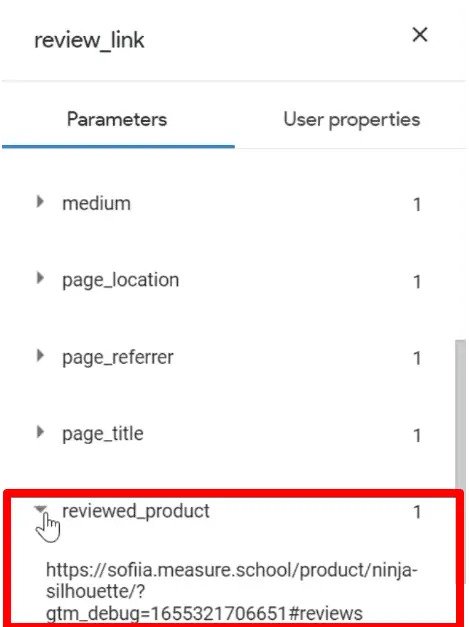
If you want to see this parameter in your reports, it is important to register it as a custom dimension. Otherwise, it will not be available.
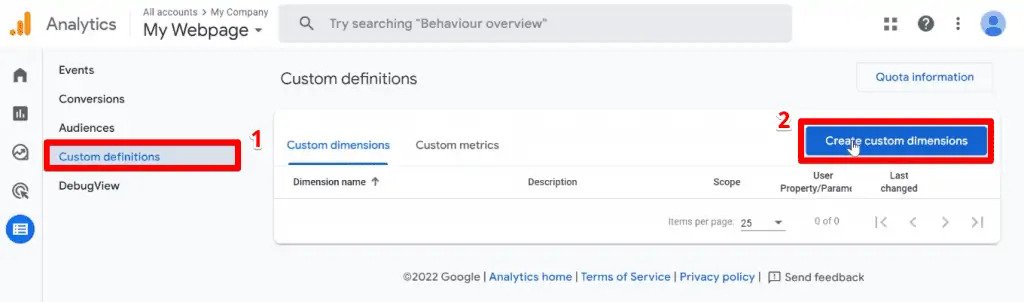
Creating a Custom Dimension
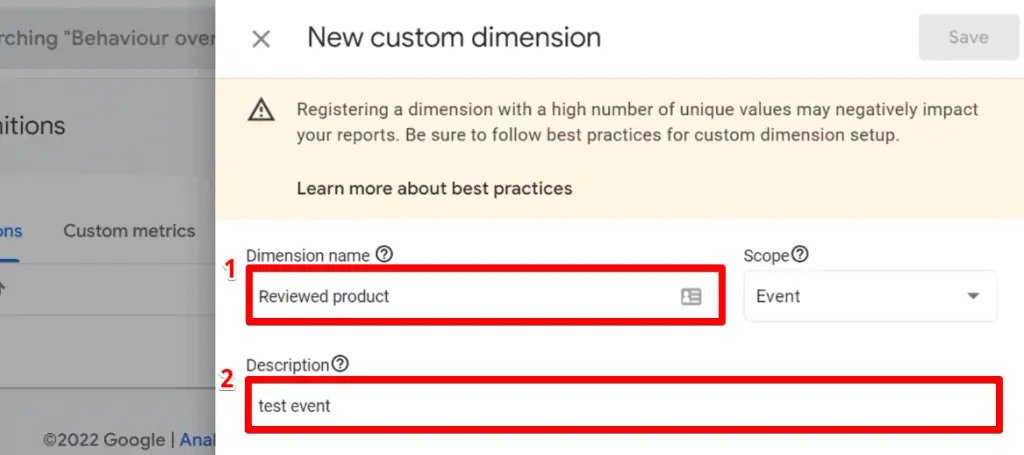
Click on Custom definitions → Create custom dimensions.
Provide a Dimension name and Description. The scope of this dimension should remain as an event.
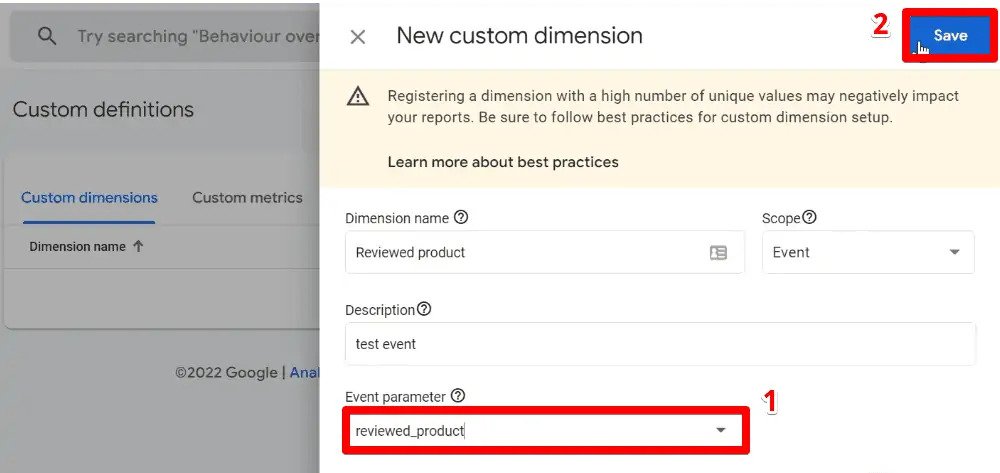
Next, you need to specify the event parameter. This should be the same as what was set up in GTM.
Let’s go back to GTM and copy the value directly to be sure that there is no mistake.
Paste this name back to Analytics and click on Save.
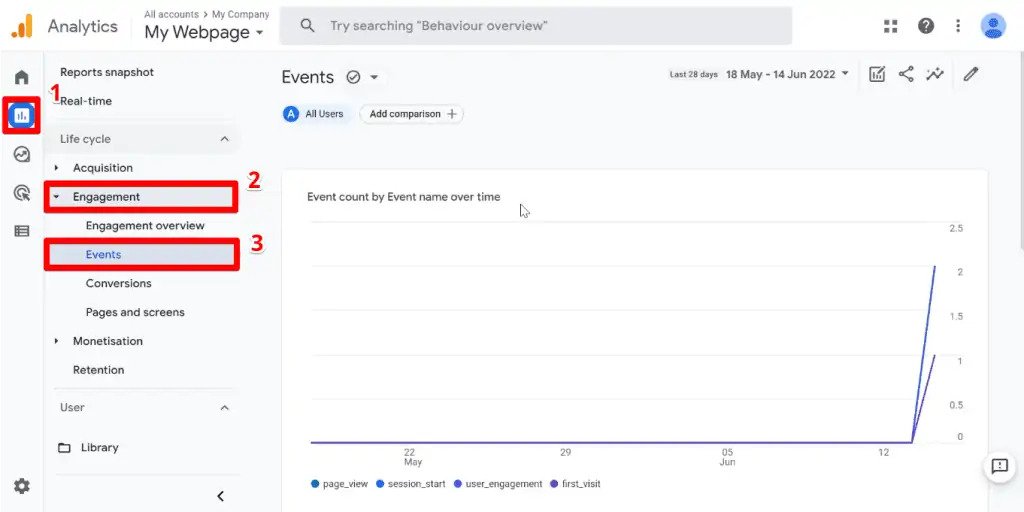
It might take up to 24 hours to appear, but you can view this custom dimension in your reports by going to Reports → Engagement → Events.
Don’t forget to publish your container by going to GTM and clicking Submit.
Provide a version name and click on Publish.
Next, let’s discuss the ways of viewing data in Google Analytics 4 and the different reports Analytics provides by default.
Standard Reports in Google Analytics 4
Your Google Analytics property comes with multiple predetermined reports to help you analyze data from your website and apps.
Understanding the reporting interface of Google Analytics 4 will allow you to analyze this data properly and obtain valuable insights to better understand user activity.
For this section, you will be working with the Google Demo account so that you can view a property already populated with a large dataset.
GA4 Home Overview
Opening your GA4 property directs you to a home section. This section gives you a summary of what is happening on your web page.
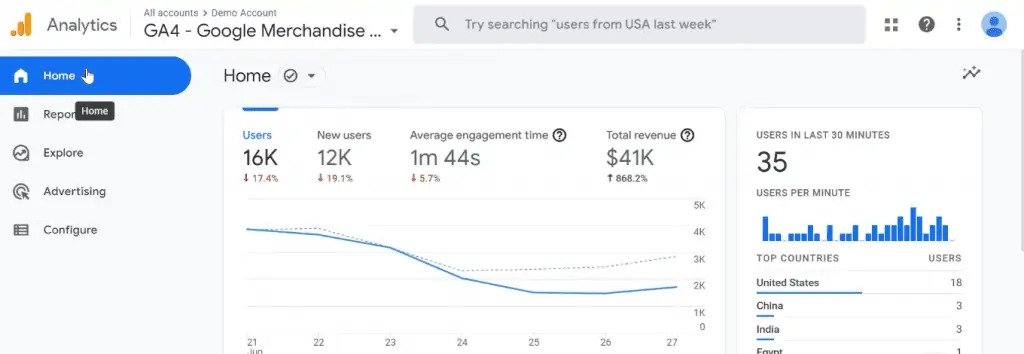
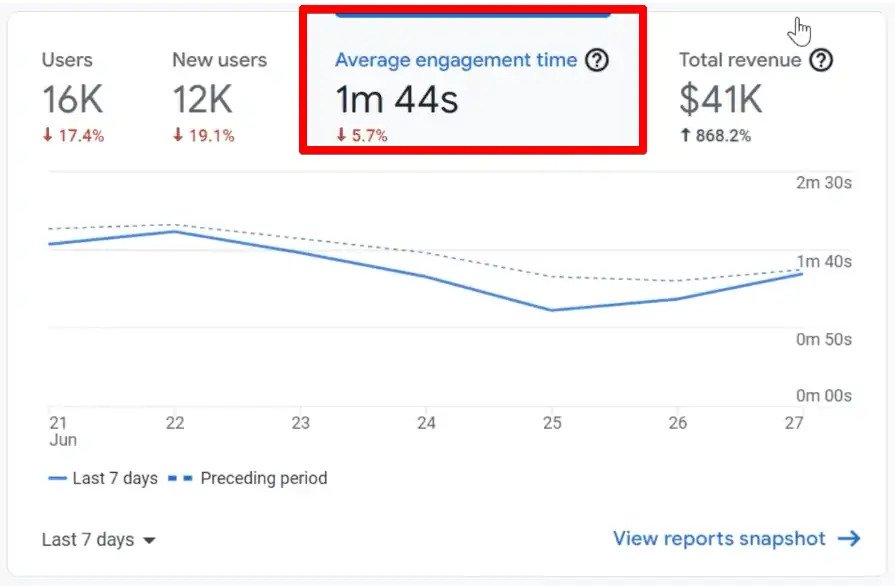
The first thing you see is a graph containing information about the total number of users, the number of new users, their average engagement time, and the total revenue generated.
Trend lines showing data for the last seven days and the preceding period can also be seen, along with the positive or negative change between the two.
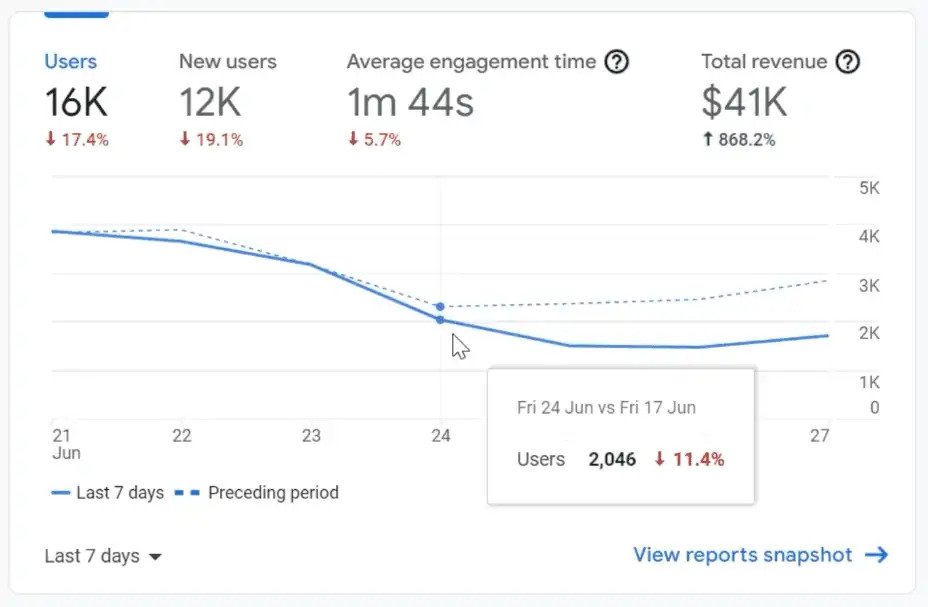
Clicking on other metrics on this graph will show their corresponding trend lines.
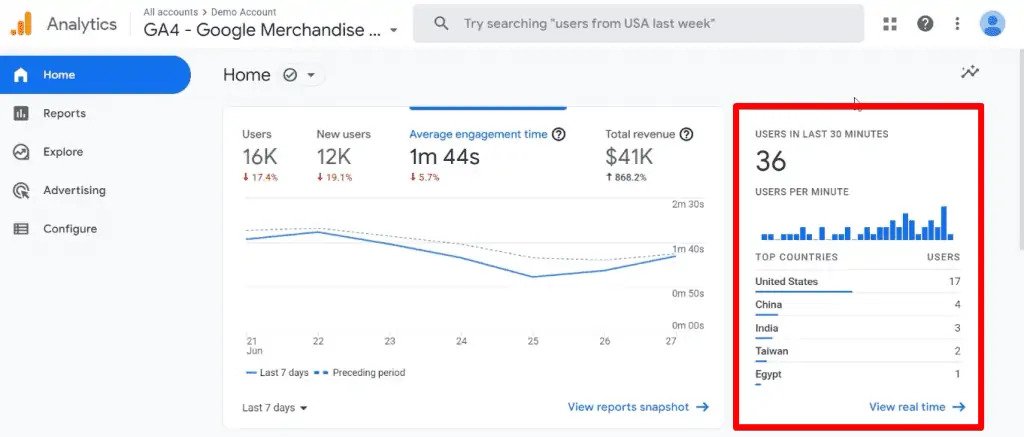
The second card is related to activity in real-time. You can see information about your users in the last 30 minutes and the top countries where these users are.
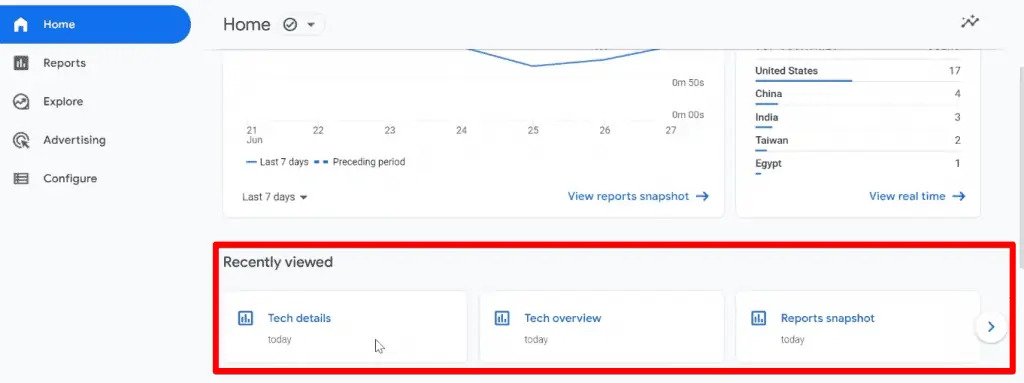
Scrolling down, you can see the recently viewed section that provides shortcuts to the most recent reports you have opened.
Further down is the most exciting feature of GA4, the Insights.
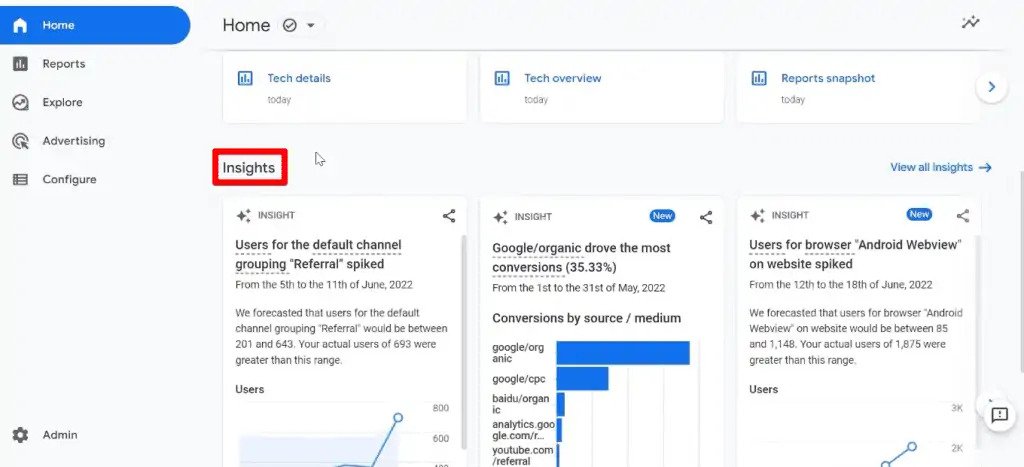
Insights are automatically provided through the use of machine learning to help you understand and act on your data. This feature detects unusual changes or emerging trends in your data and presents them in this section.
You can also create custom insights for the data that is important to you. Just provide conditions that will detect changes to see these insights. Luckily, you can create up to 50 custom insights per property.
Let’s now discuss the different reports in your GA4 property.
GA4 Reports
Click on the Reports tab present below the home tab.
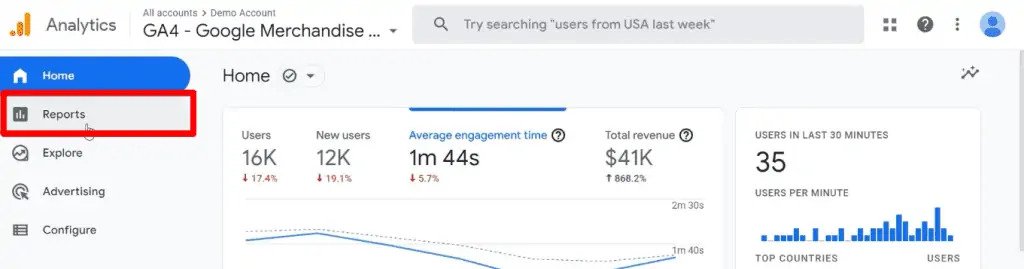
Each Analytics property includes a Reports snapshot report, a Real-time report, the Life cycle collection, User collection, and App developer collection (for those who have connected a mobile app to their property).
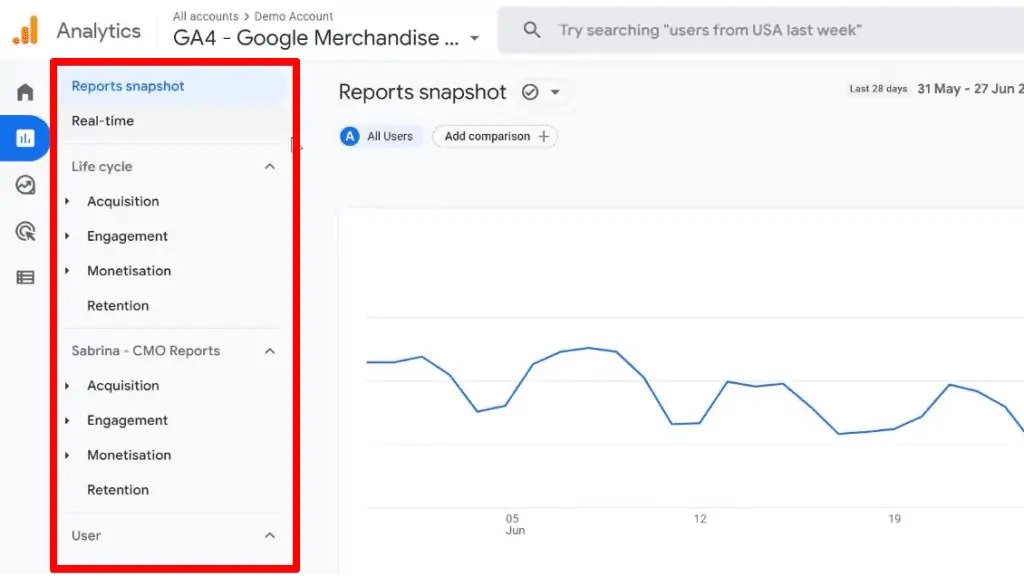
You will notice that there is another collection of reports on this property. This is an example of a custom report. You can create a new collection where you can include the reports you would like to have or even customize the predefined reports.
Let’s start by discussing the Reports snapshot.
The Reports snapshot helps you in navigating your analysis. It is the overview report displayed when you click on the Reports tab. Any overview report can be set as the Reports snapshot.
By default, you can see a summary of user activity on your web page, the number of users, total event count, number of conversions, and total revenue. Below, a real-time count of users on your page and an insights card can be seen.
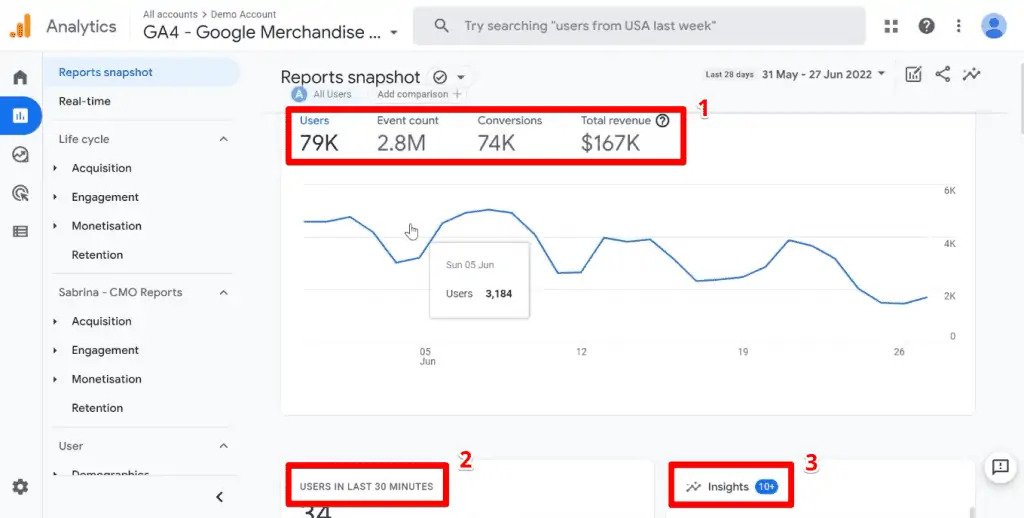
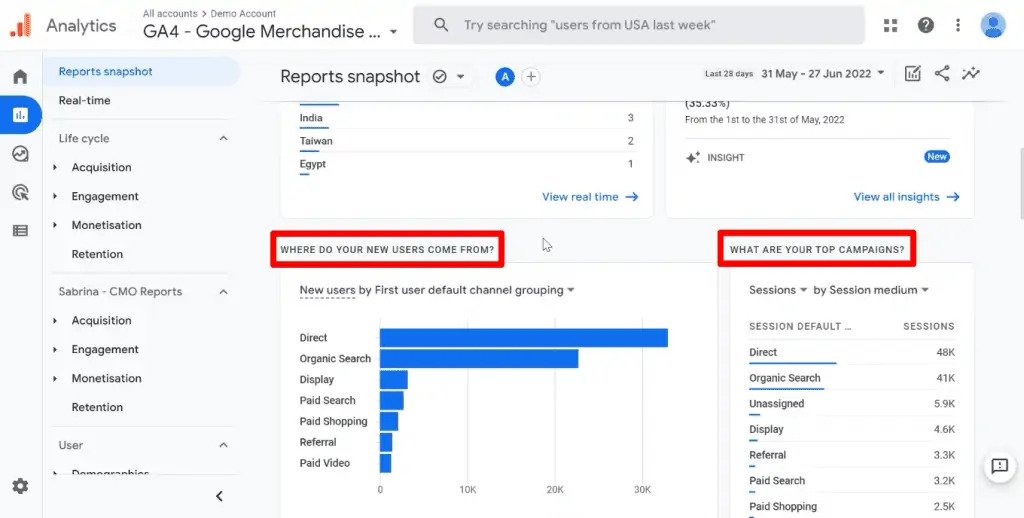
There are also cards with questions that should help you get some additional insights.
For example, cards for where your new users are coming from and what your top campaigns are can be viewed.
Something that you can see at the top of any report is a data sampling indicator. The green check mark indicates that this report is unsampled.
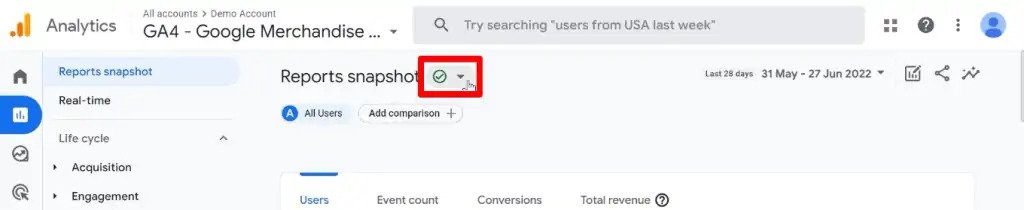
What is data sampling? In data analysis, sampling is the practice of analyzing a subset of data to uncover meaningful information in the larger dataset.
Standard reports are always unsampled. Sampling might happen in the explorations section that we will discuss later, or when your analysis exceeds 10 million events.
Going to any of the cards and clicking on it will direct you to that specific report.
Click on View real-time.
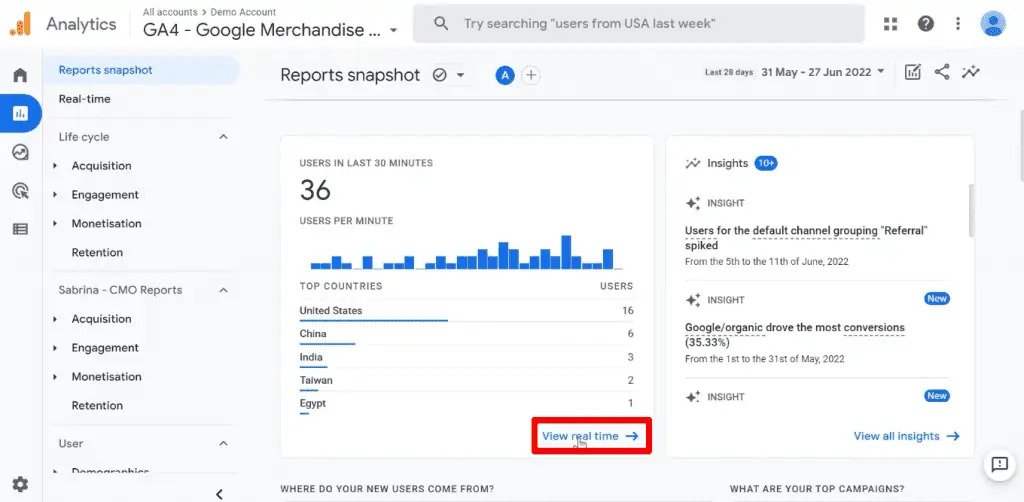
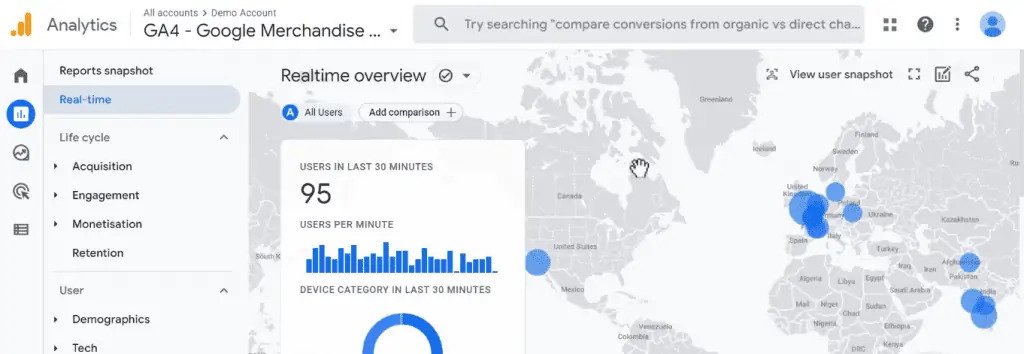
This takes you to the Real-time report.
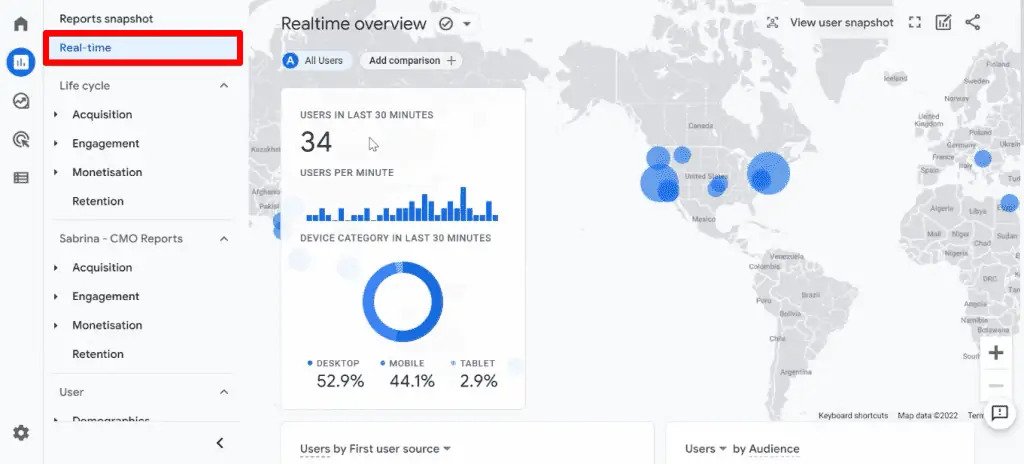
Here, you can see what is happening on your web page. You can see information about your users, the devices they are using, the pages they are on at the moment, and so on.
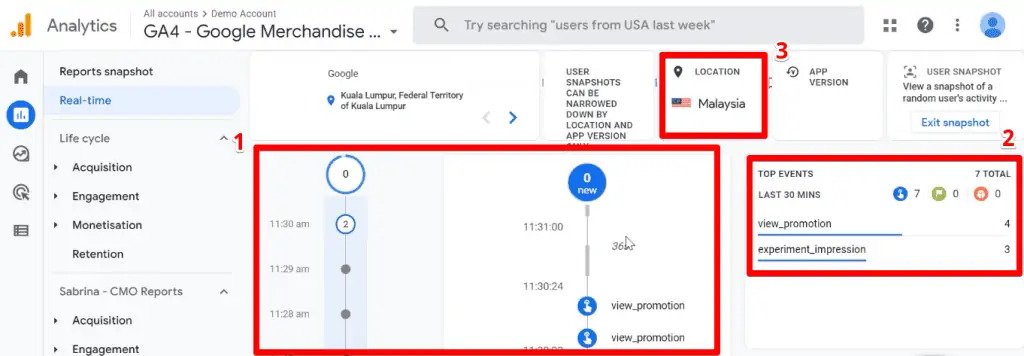
An interesting feature in this report can be accessed by clicking on View user snapshot at the top of the report.
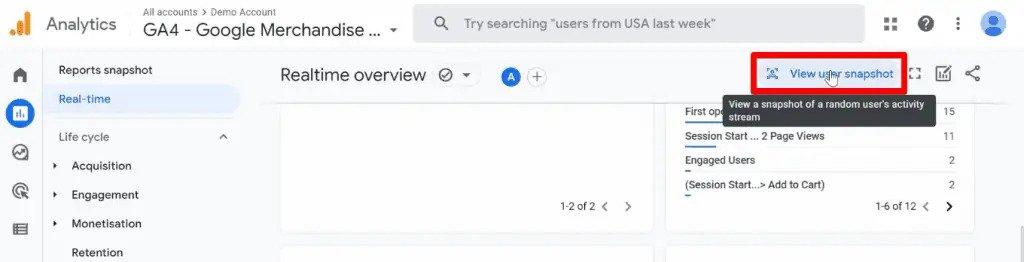
This allows you to view a snapshot of a random user’s journey on your website or app. You will not be able to see specific information about the user, but you can see the events they fired.
The view is similar to the one in the DebugView where there is a timeline of the events the user triggered, their top events over the last 30 minutes, and the location of the user.
Next, let’s look at the different collections that appear in the report navigation.
A collection is a set of reports. By default, the Life cycle and User collections are present in all GA4 properties. A collection can be further divided into topics which is a subset of reports within a collection. Each topic contains an overview report and one or more detailed reports.
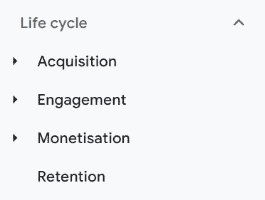
Life Cycle Collection
The Life cycle collection helps you break down user activity at each stage in the customer user journey. Under this collection are the Acquisition, Engagement, Monetization, and Retention topics.
Acquisition Reports
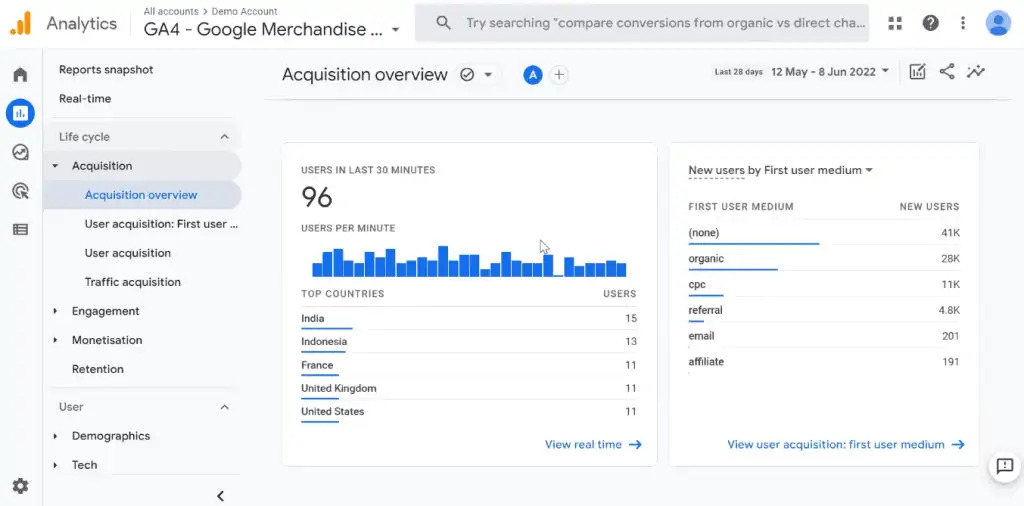
Reports under the acquisition topic give you information on how users arrive at your web page.
Looking at the Acquisition overview report, you are greeted by a summary card.
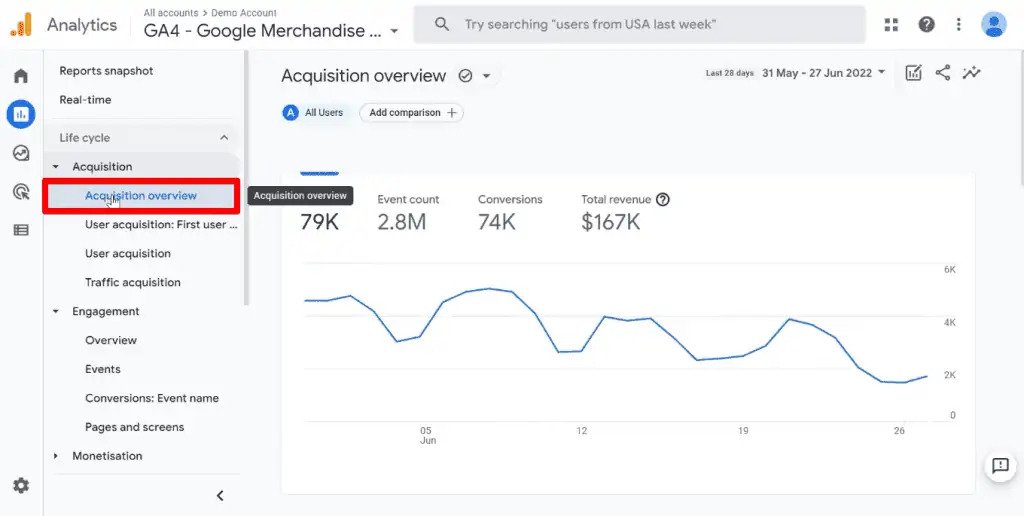
Like other overview reports, there is a real-time card and summaries of each report within the topic under the summary card.
Another thing you can do with reports is to change the timeframe of the analysis.
Click on the date range at the top right portion of the report.
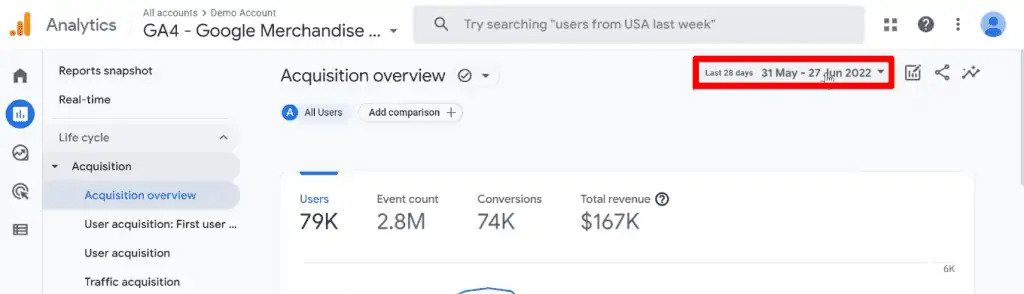
You can select from a list of predefined periods or create a custom one. There is also a feature to compare data from the preceding period. Click on Apply to save the timeframe changes.
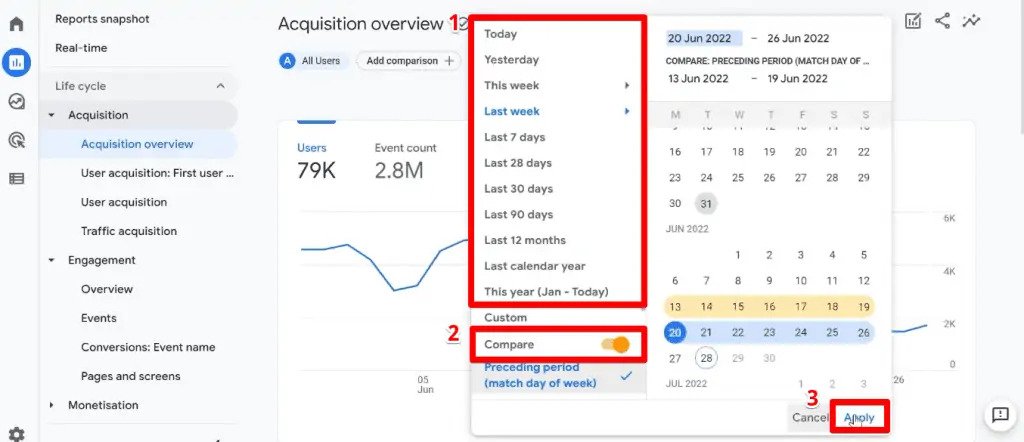
If you had enabled the comparison feature, the increase or decrease in your data can be seen in the cards. This allows you to identify some helpful trends or changes.
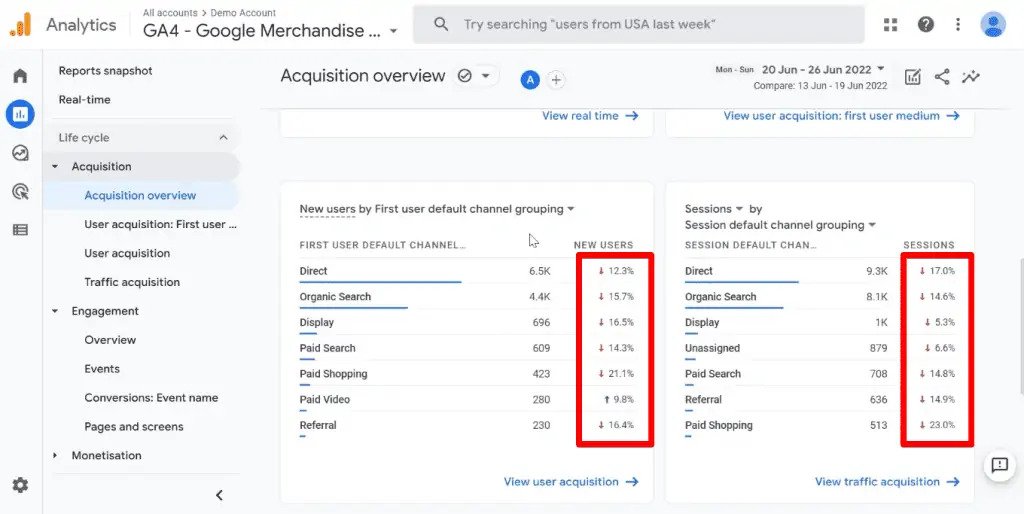
Let’s remove the date comparison and explore other features you can see on a reports page.
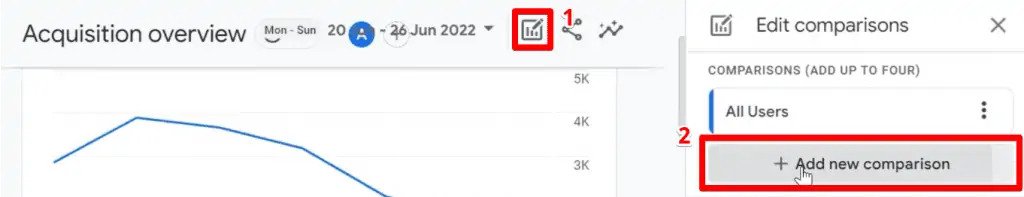
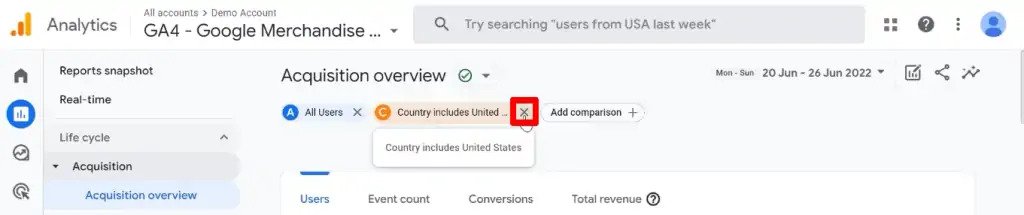
Let’s say you want to compare all users against users from the United States.
You can add a comparison point by clicking on the Edit comparisons button → Add new comparison.
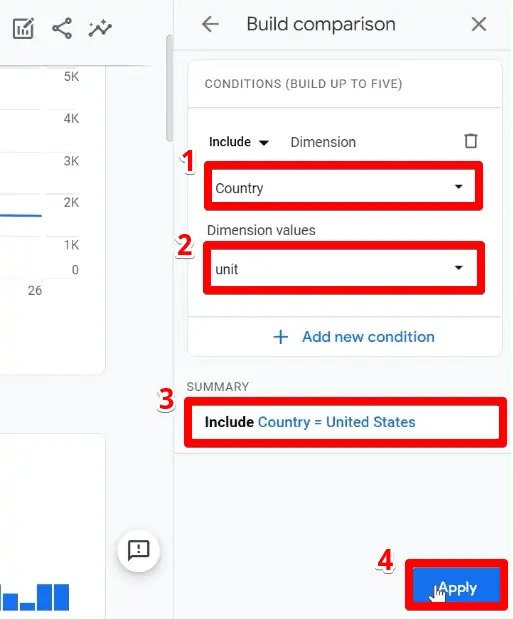
Select the Country dimension. Search for the United States in the dimension values. Then, confirm this condition by checking the Summary section. Finally, click on Apply.
A legend of the different comparisons you have enabled can be seen at the top of the report.
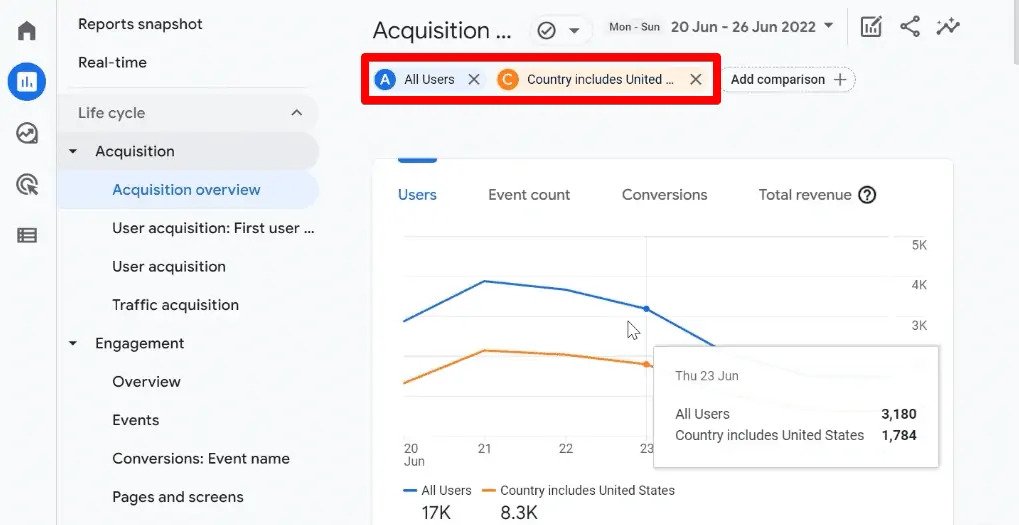
You can also see that the reports either have additional trend lines or columns indicating the data for the specified comparison points.
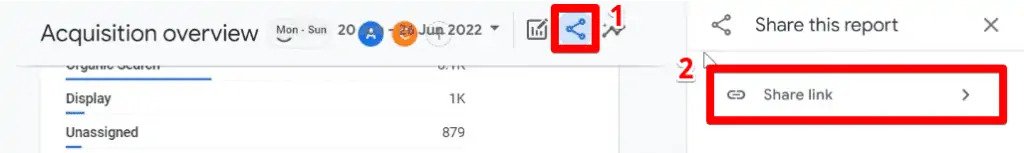
Another feature is the ability to share this report with your colleagues.
You can share this report by clicking on the Share button → Share link.
The last feature is Insights which we had a preview of in the home overview section. If you don’t know where to start with your analysis, looking at the insights section can help you see meaningful information about your data.
You can access this feature by clicking on the Insights button beside the share button. A panel will open on the right side of your page.
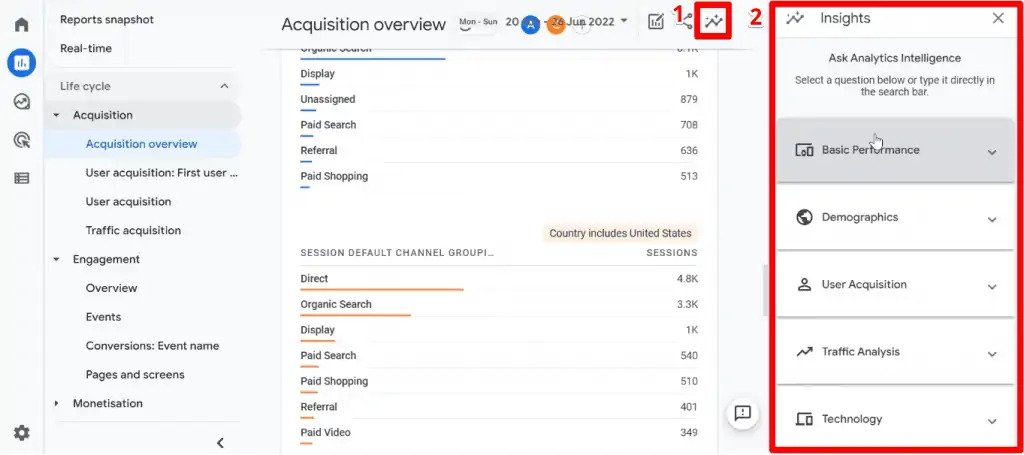
The insights panel has a bunch of categories that group the questions you may have regarding your data. These questions can help you find some valuable insights into your data.
To illustrate, let’s open the Basic Performance category and select the “On what days do I get the most users?” question.
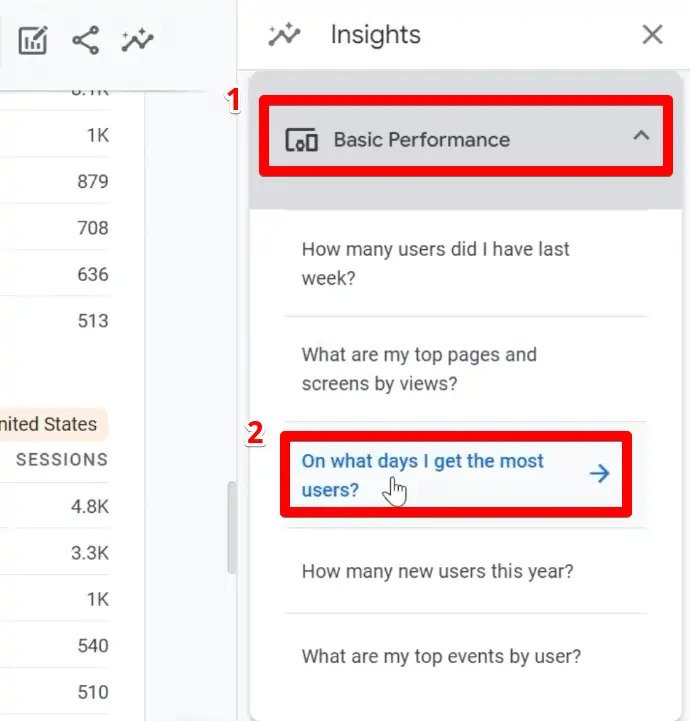
You are presented with a table showing the number of users you get for each day of the week, sorted in descending order.
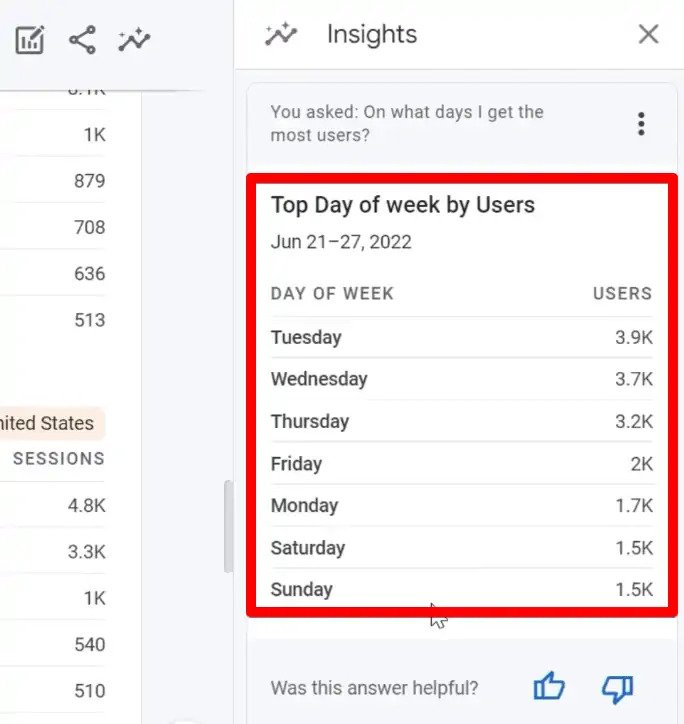
Whether you’re a beginner or a Google Analytics expert, using the insights feature provides quick interpretations of your data.
Before moving on to the detailed reports from the acquisition topic, let’s clear the comparison by clicking on the  button.
Now, let’s go to the User acquisition report.
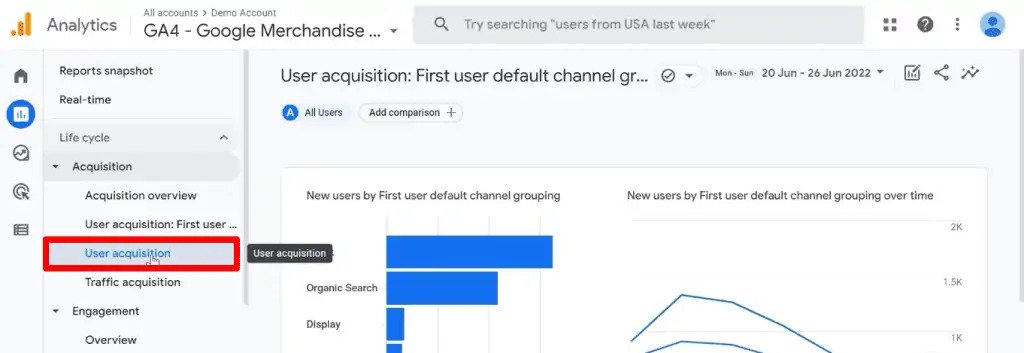
The user acquisition report gives you information on how your users are getting to your web page for the first time.
Scrolling down, you can see a detailed table containing different metrics related to how you first acquired a user.
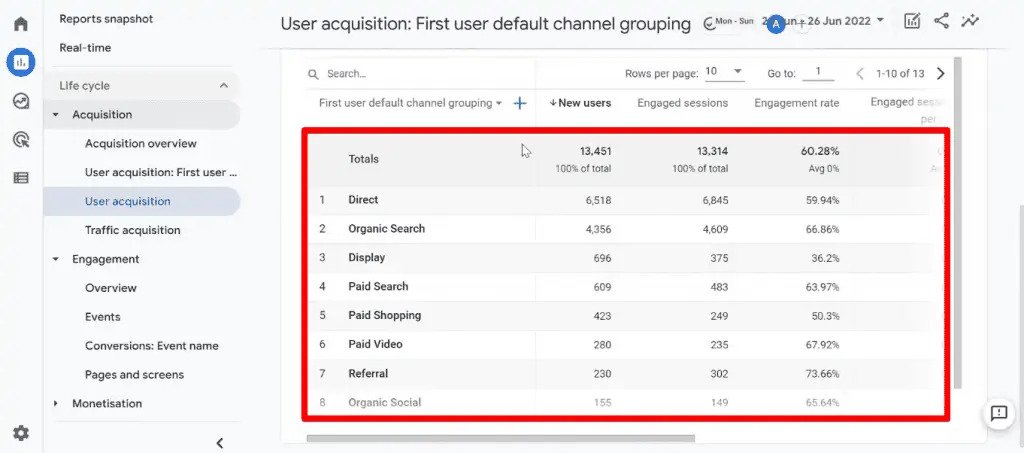
You can change the table’s primary dimension by clicking on the dimension picker below the search bar.
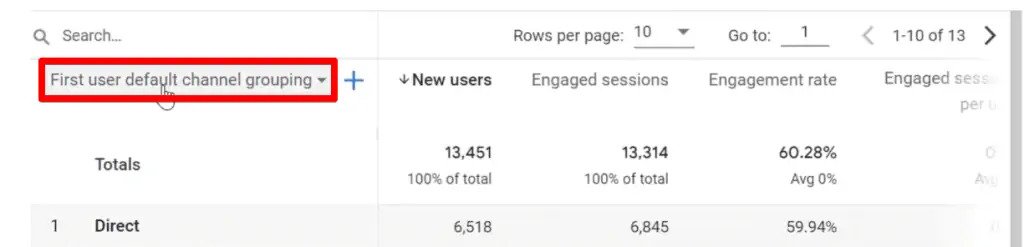
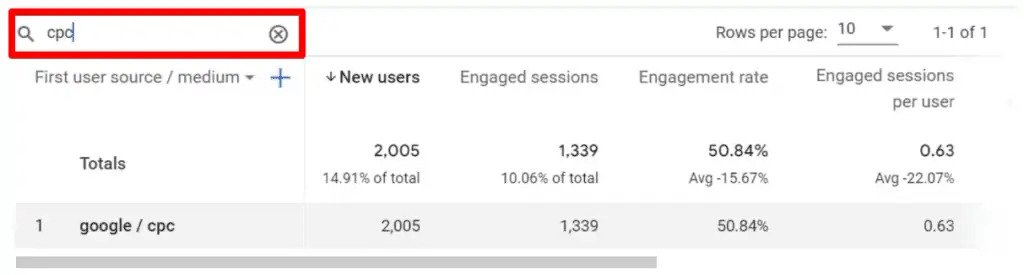
Using the search bar can help filter the table to only show the data you need.
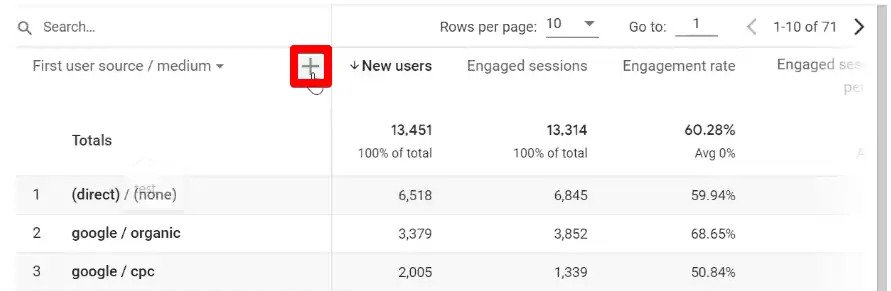
Lastly, you can also add a secondary dimension if you want by clicking on the + button.
The last report under the acquisition topic is the Traffic acquisition report.
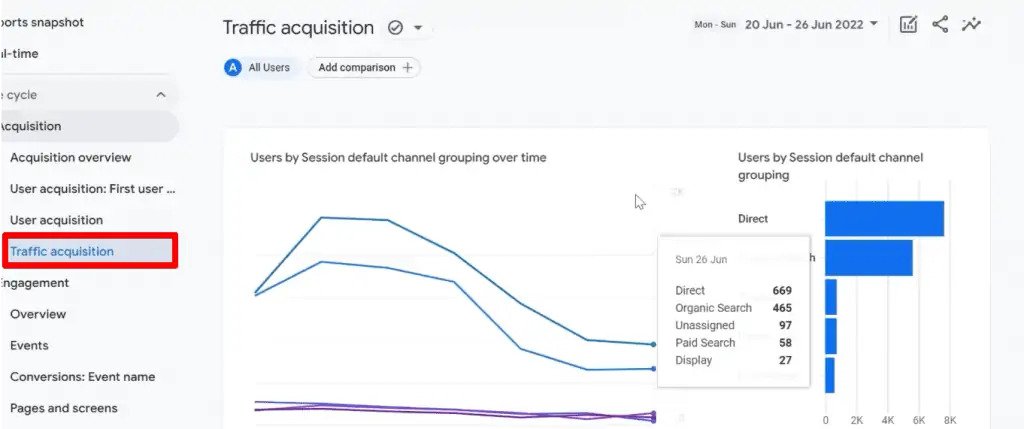
This report shows information about new and returning users. It also has a detailed table where you can tweak the data being presented. It’s similar to how we tweaked the user acquisition table, but the metrics present are more session-related.
Engagement Reports
Moving on to the next topic under the life cycle collection, we have the engagement reports. These reports let you measure user engagement by the events, conversion events that users trigger, and the web pages and app screens that users visit.
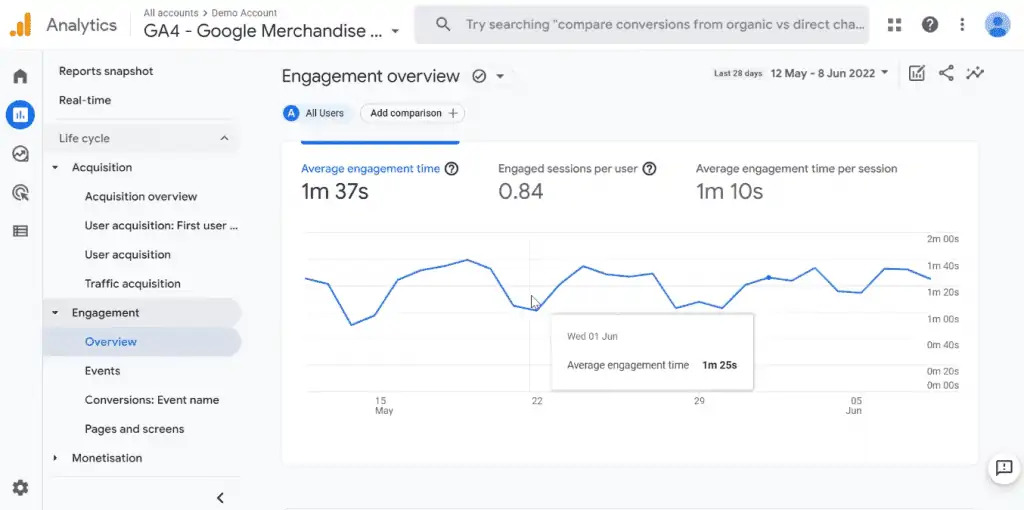
Let’s look at the Engagement Overview report.
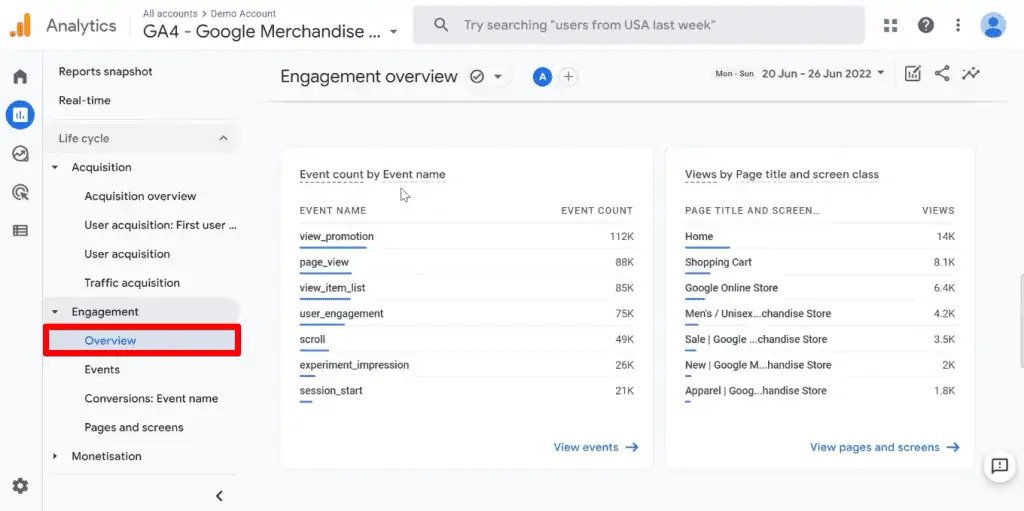
This shows how users are interacting with the content on your web page. Here, you can see details such as the average engagement time, engaged sessions per user, and average engagement time per session.
By this point, you may have noticed that Google Analytics 4 collects a lot of data from your website or app. Although we’re about halfway through the different report types, it may feel like we have encountered countless dimensions and metrics.
Remembering what each is about can be difficult, especially if you are a new user. Therefore, it is highly recommended to check out the Google documentation every time you’re uncertain about the exact definition of the dimension or metric you are looking at.
The first detailed report for this engagement topic is the Events report.
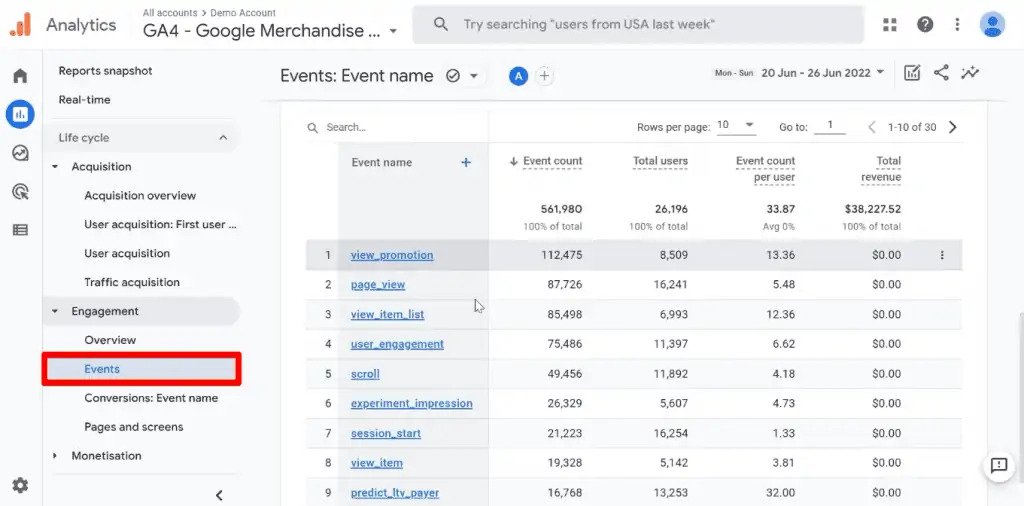
This report shows the user activity on your web page. You have a graph of the event count over time, a list of events, total users that triggered the event, etc.
The next detailed report is for Conversions.
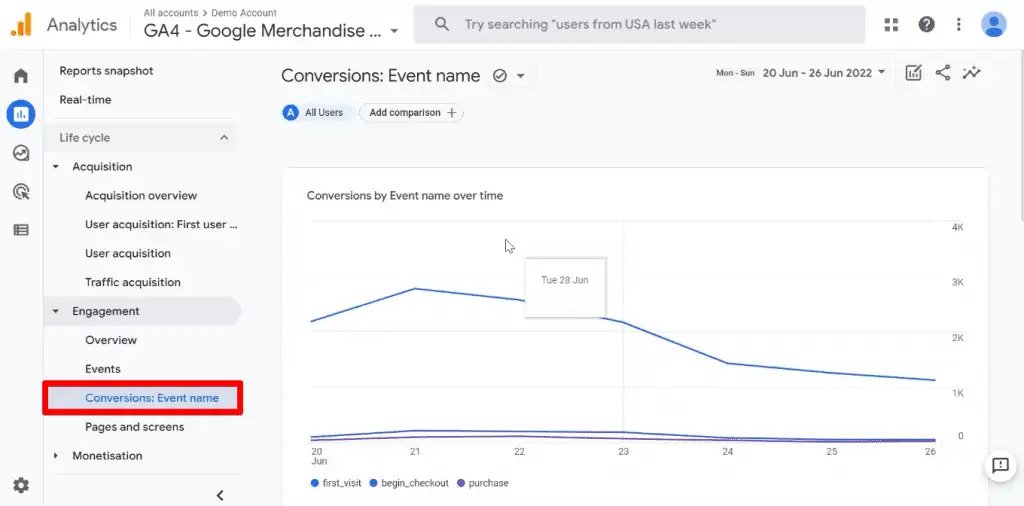
Conversions are events that are valuable for your business. This report also has a table that shows the number of conversions for a specific event, and the revenue generated if you have assigned a monetary value to a specific conversion.
Lastly, we have the Pages and screens report.
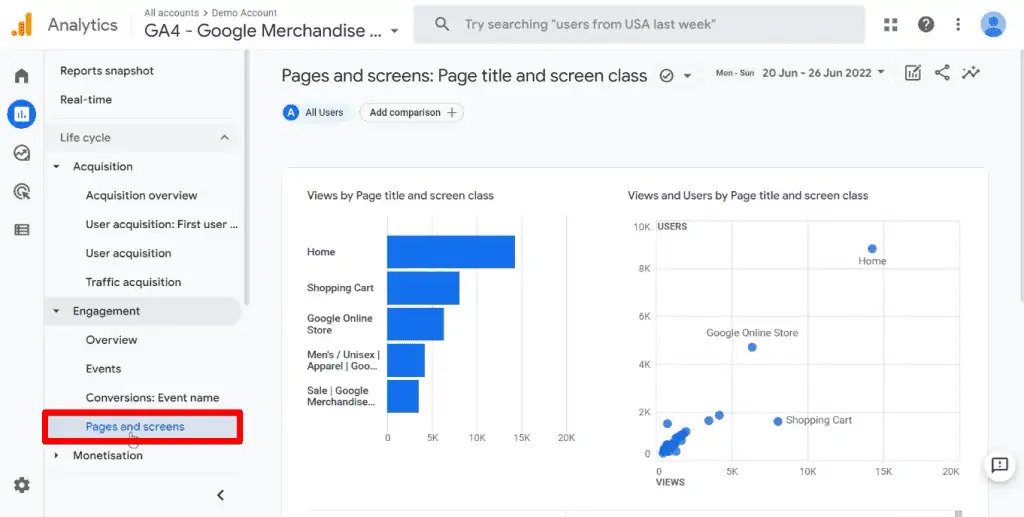
Here, you can see the pages (or screens if you have an application) your visitors are going to. The detailed table will show the number of views for each page, the total number of users that visited, as well as the number of new users.
Monetization Reports
The next topic from the life cycle collection is the Monetization reports which present information about the revenue you’re generating.
Looking at the Overview report, the first graph shows the total revenue, eCommerce value, and total ad revenue.
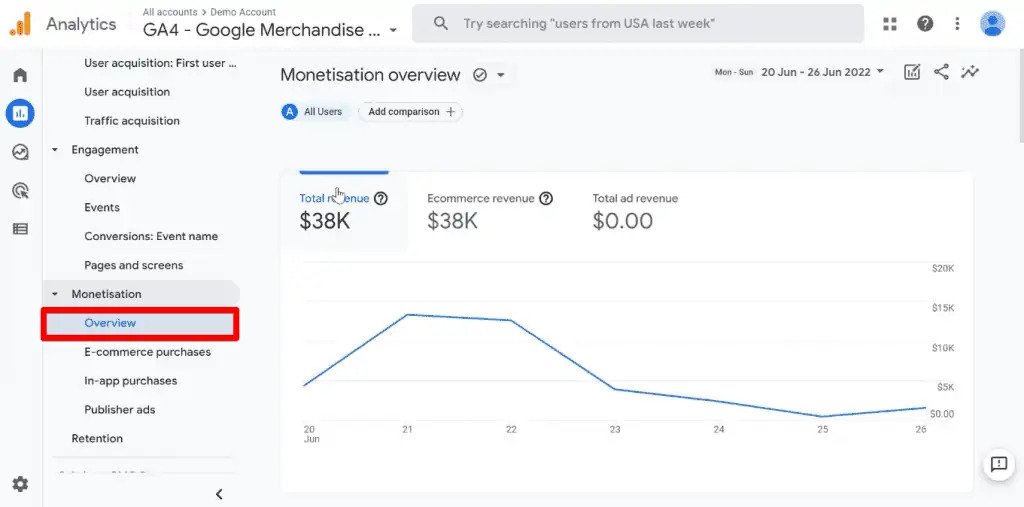
The eCommerce revenue is the revenue you are generating if you have eCommerce tracking implemented. Meanwhile, the total ad revenue will only be displayed if you have Google Ads Manager integration.
The E-commerce purchases report lets you check the items you are selling and their performance.
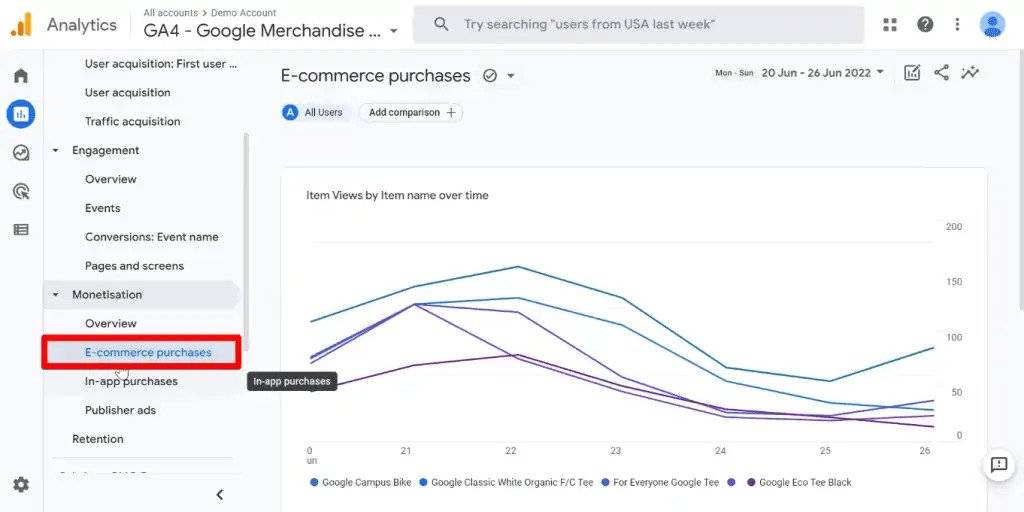
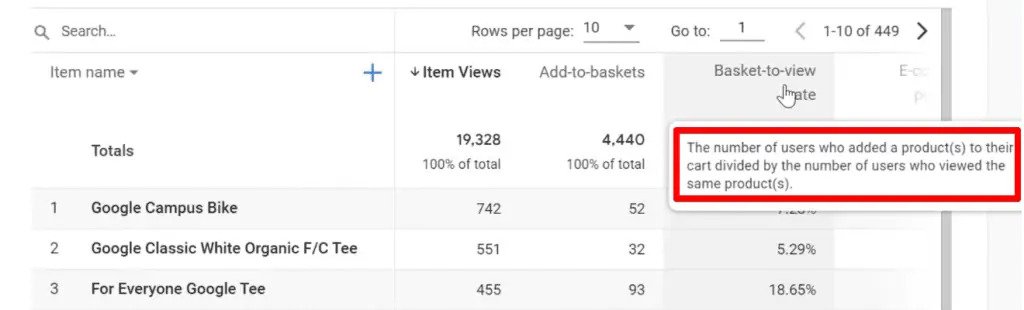
You can see what products your users are buying, how many views an item gets, how many items get added to the basket, the basket-to-view rate, etc.
Another quick and easy way to determine what a specific metric or dimension means is by hovering the mouse over it. This gives you a pop-up that gives the description.
Looking at the In-app purchases report will show you that no data is available.
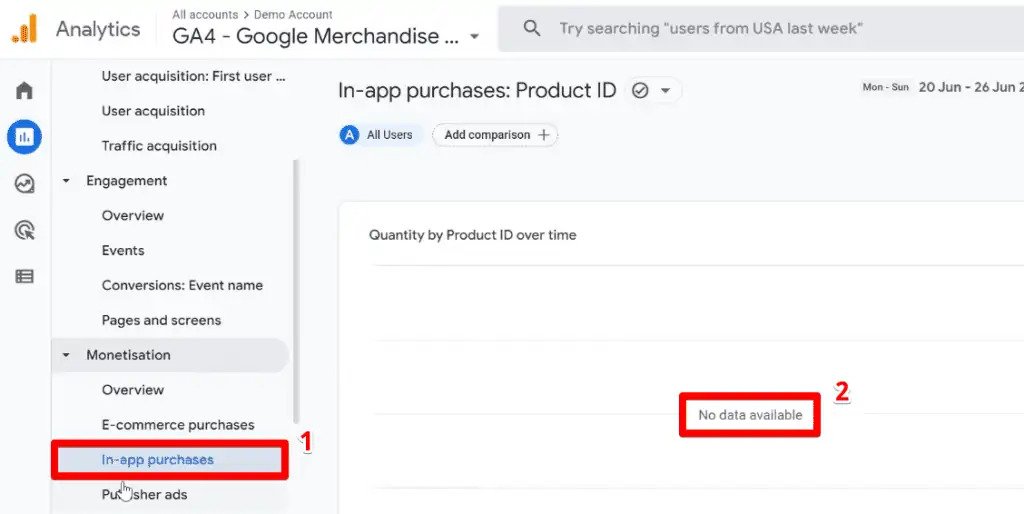
The publisher ads report will also tell you that no data is available. These two reports are related to applications and the revenue you generate with your app and publisher ads. They are empty because the Google demo account only gathers data from a web page.
Retention Report
The last report you can view from the life cycle collection is the Retention report.
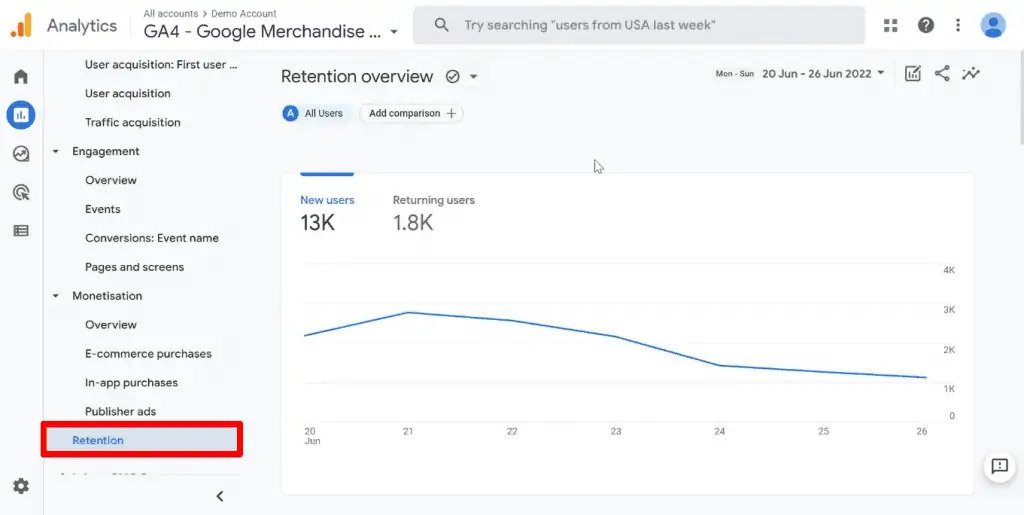
This report tells you how frequently and how long users engage with your web page. You can see data about new and returning users.
Cards about user retention, user engagement, and lifetime value are also available. The grouping of data by cohorts is a helpful feature if you have divisions for your users, or have a user ID implemented.
User Collection
The next collection is the User collection which has the demographics and tech topics.
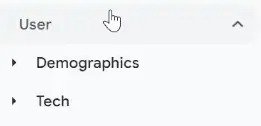
The User collection helps you understand the people who use your websites and apps, by providing information such as their age, interests, devices, and app versions.
Let’s first look at the Demographics overview report.
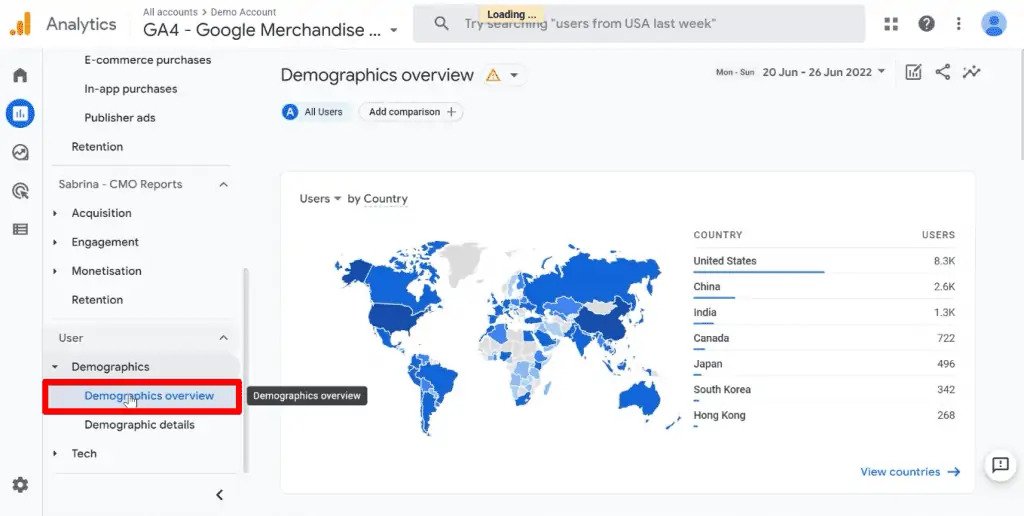
Here, you can see data about your users, the country, town/city they are from, their gender, interests, and age. Currently, data on gender, interests, and age is not available in the Google demo account.
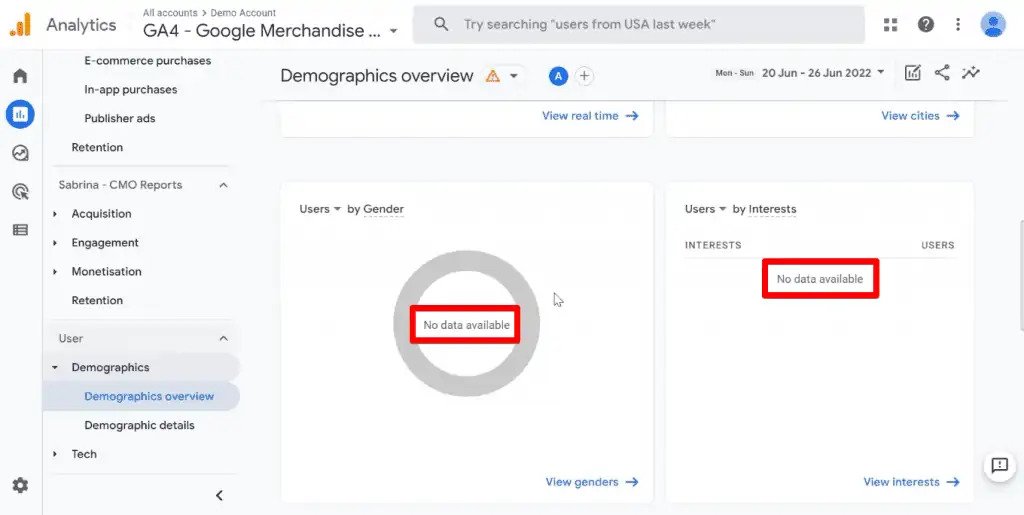
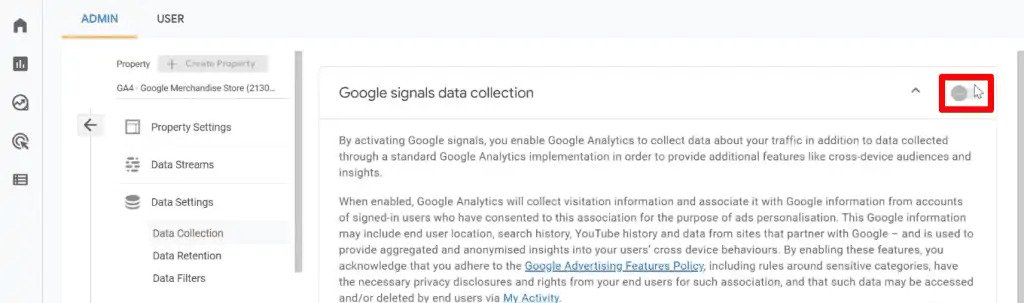
To see this data in your report, you need to activate the Google signals feature.
Go to Admin → Data Settings → Data Collection.
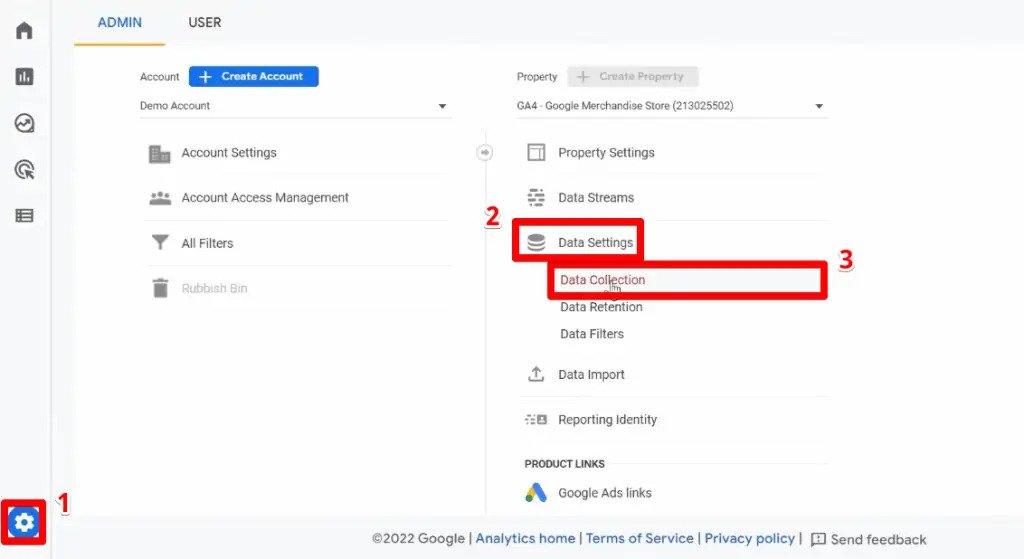
Here, activate the Google signals data collection.
Going to your Tech overview report, you will see the technologies your users are using while browsing your web page or application.
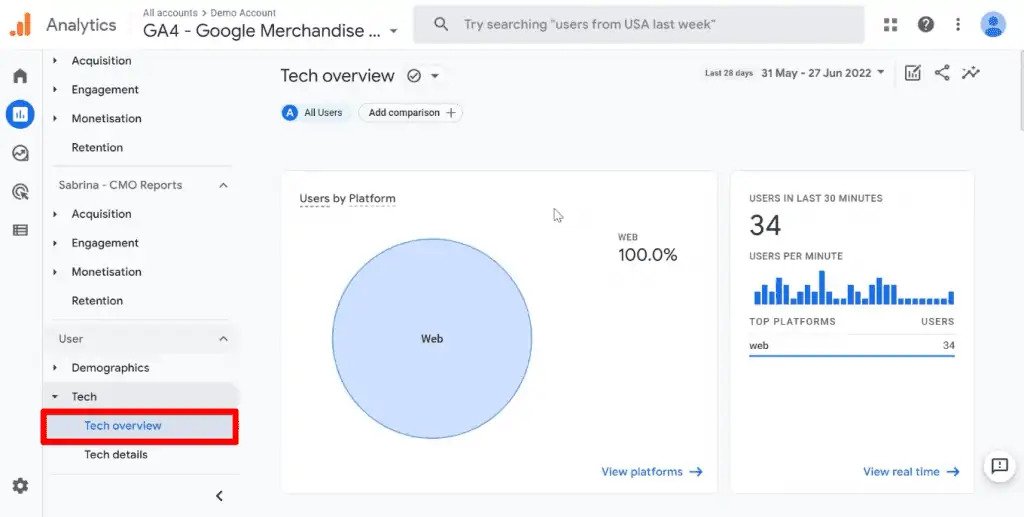
You can also see the operating system your users use, their device category, and the browsers they used.
Lastly, the Tech details report also provides a detailed table showing the traffic by the technology your audience uses.
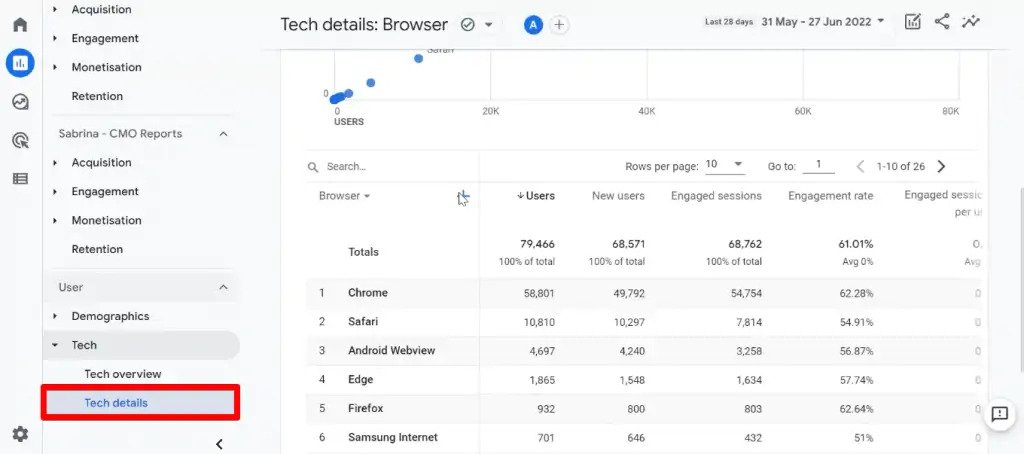
This and other tables under the detailed reports for each collection are similar in the sense that you can change the information shown, provide a secondary criterion, filter results, etc.
That is an overview of the standard reports in Google Analytics 4.
Now that you can view your data, let’s analyze this data further by using the GA4 explorations.
How to Use GA4 Explorations
Google Analytics 4 exploration reports let you go beyond standard reports to help you gain deeper insights into your customers’ behavior.
Using exploration reports allows you to carry out an in-depth analysis, uncovering useful details about your website and/or mobile app performance. With exploration reports, you can apply different visualization techniques to dive into your data in detail.
If you have a specific question that you would like to answer using your data, the Explorations section is the place to look for answers.
You can access it by clicking on the Explorations tab below the Reports tab.
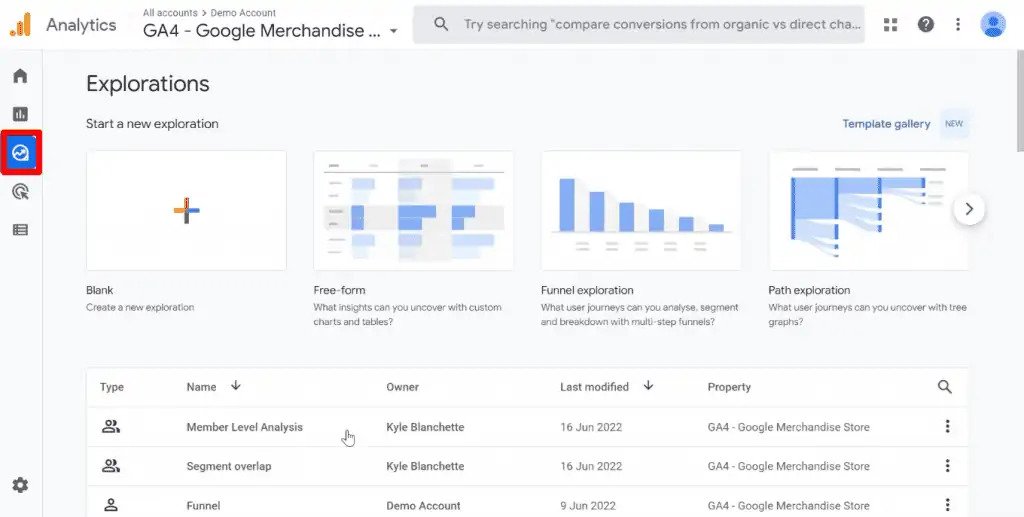
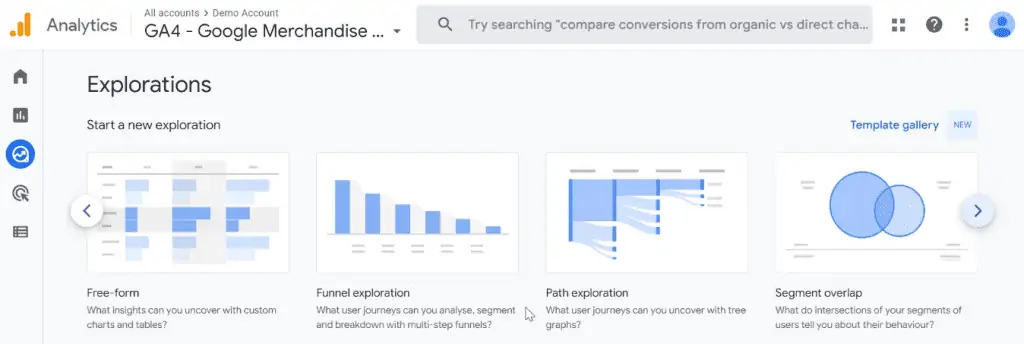
Here, you can create a new exploration report from scratch or utilize the templates for various exploration techniques. These pre-configured techniques allow you to analyze your data from different angles using a set of common dimensions and metrics.
Let’s discuss each one in detail!
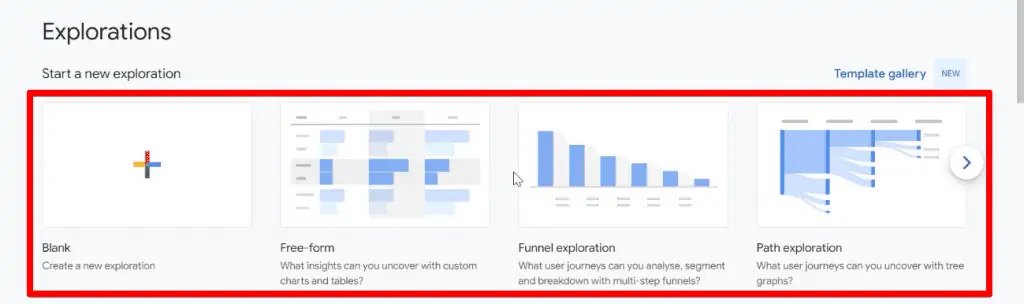
Exploration Techniques
Free-form exploration allows you to explore your data in a familiar crosstab layout. This exploration technique can apply several visualization styles, including bar charts, pie charts, line charts, scatter plots, and geo maps.
The Funnel exploration allows you to visualize the steps users take to complete tasks on your site or map. Next, Path exploration lets you visualize the path users take as they navigate your website or app, and how they interact with your content.
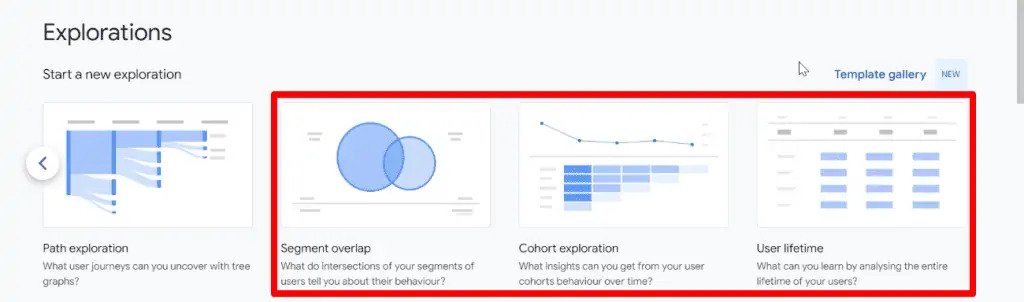
Segment overlap can help you see how different user groups/segments relate to each other. This technique allows you to identify new segments of users who meet complex criteria.
Next, the Cohort exploration allows you to gain insights into the behavior and performance of a group of users related by common characteristics. Lastly, the User lifetime allows you to explore user behavior and determine user value over their lifetime as a customer.
Due to some privacy regulations in the Google demo account, you only got to see 6 exploration techniques where there are usually 7.
The technique that you did not see is User exploration. This allows you to examine the users that make up the segments you create or import. You can also drill down into individual user activities.
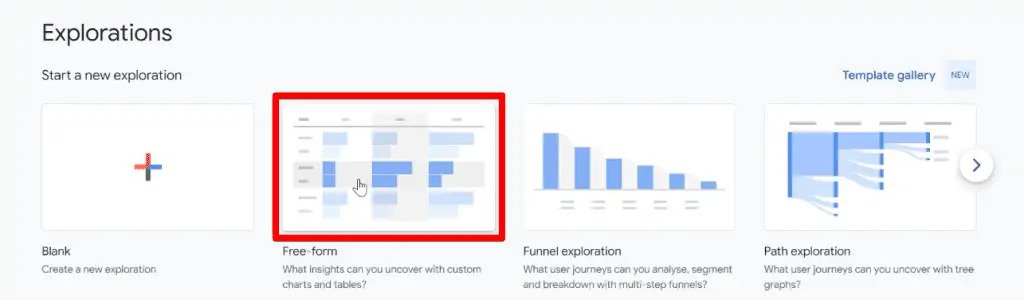
Free-form Exploration Technique
Let’s go ahead and explore the free-form exploration technique.
Click on Free-form in the explorations section.
This opens the explorations editor layout, where there are two columns on the left and the breakdown area on the right side.
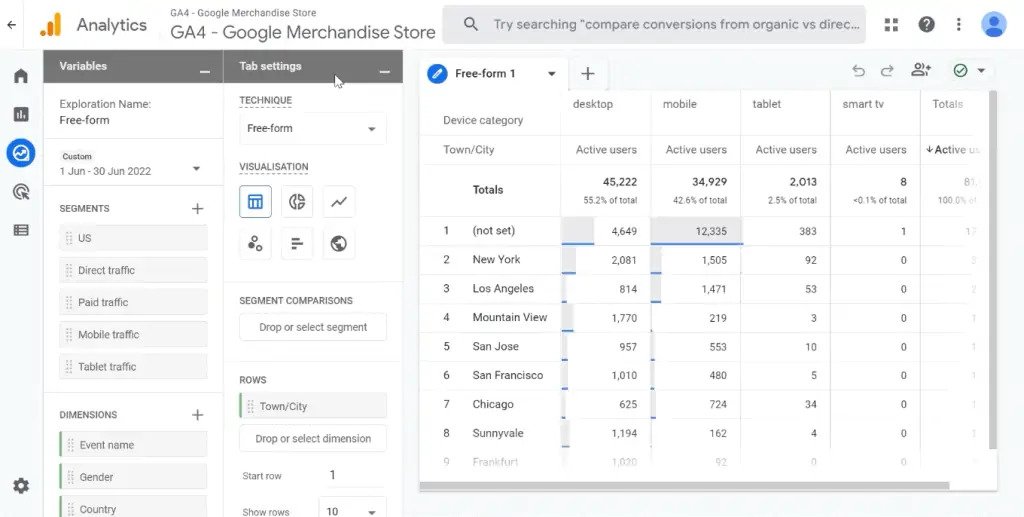
The Variables and Tab Settings columns are where you configure your report. For the free-form exploration technique, the default visualization in the breakdown area is a table where the results of your configuration can be seen.
Let’s first look at the Variables column.
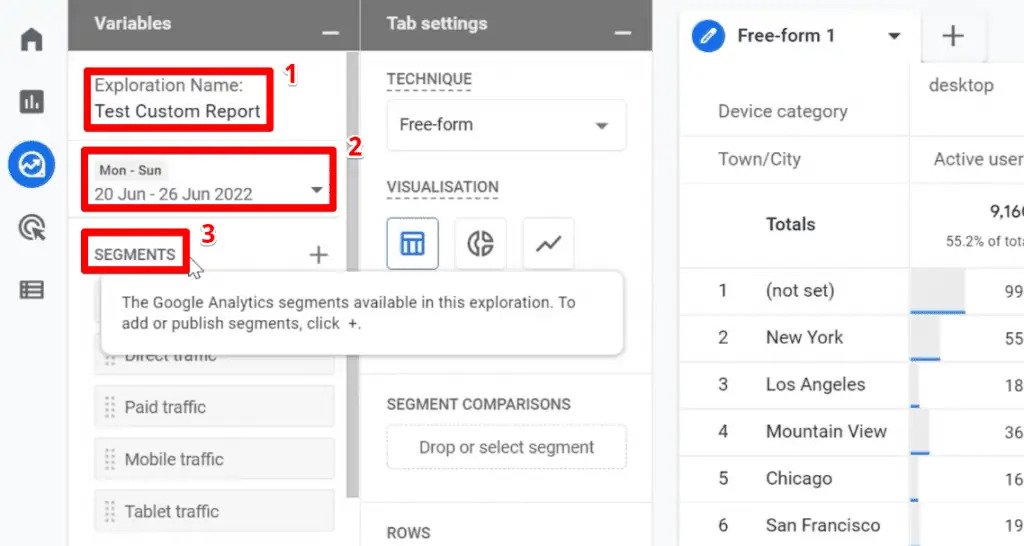
The first thing you can configure is the Exploration Name. Then, you can choose a time frame of data you wish to see in your report. You also have a list of Segments which are the different subsets of users you can use to configure your report.
Further down are the Dimensions and Metrics.
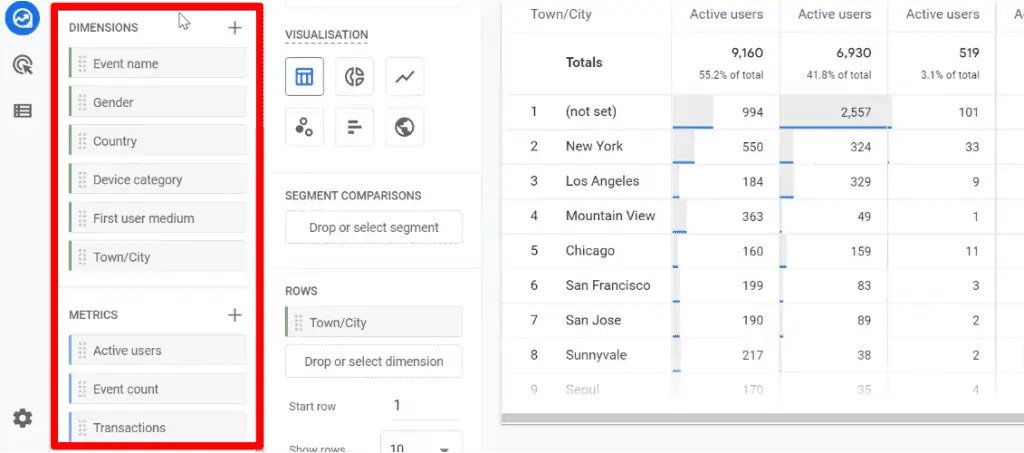
The dimensions and metrics are the components or building blocks of your report. Dimensions are colored green and are the aspects of your business you want to analyze. On the other hand, metrics help you measure and are colored blue.
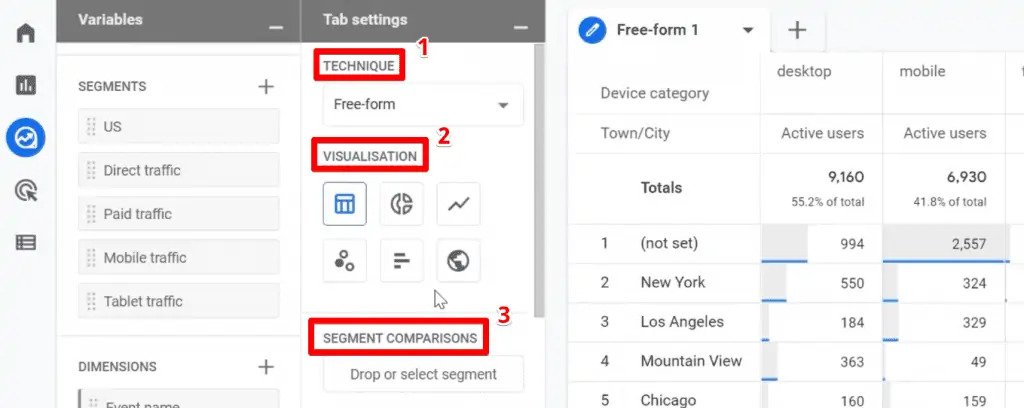
Let’s move on to the Tab settings column.
Here, you can change the exploration Technique if you want to. You can also select a Visualization method by choosing from a table, different chart types, and a geo map. The Segment Comparisons section is where you add the segments for your analysis.
Next, you have the Rows and Columns section where you add the dimensions for analysis.
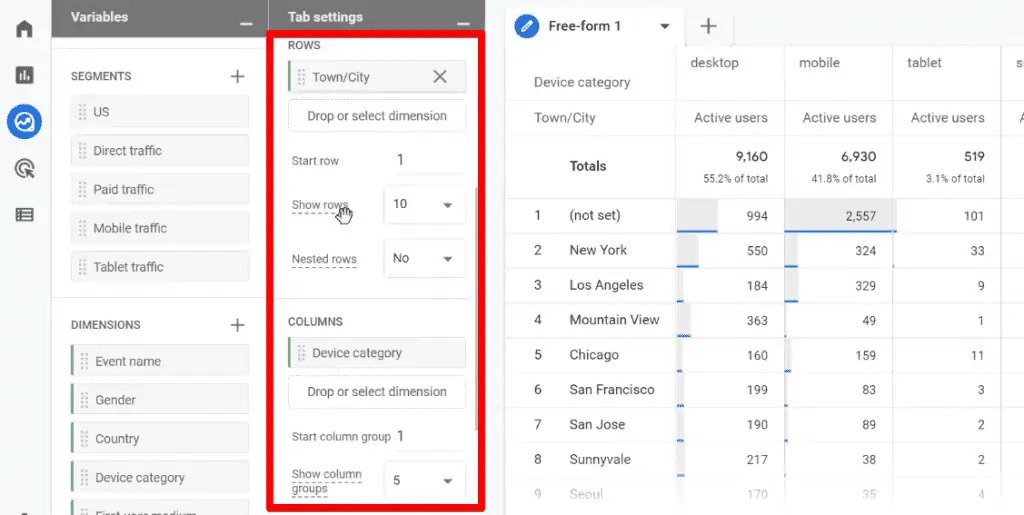
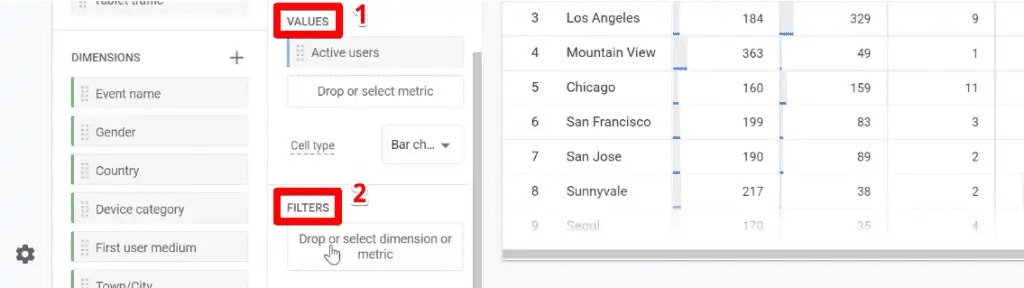
Next, the Values section is where you place the metrics you have measured. Lastly, there’s a Filters section where you can drop or select specific dimensions or metrics to filter out your data if you want to include or exclude something.
Let’s say you want to work with a specific segment, dimension, or metric. If it is not present in the list from the variables column, what do you do?
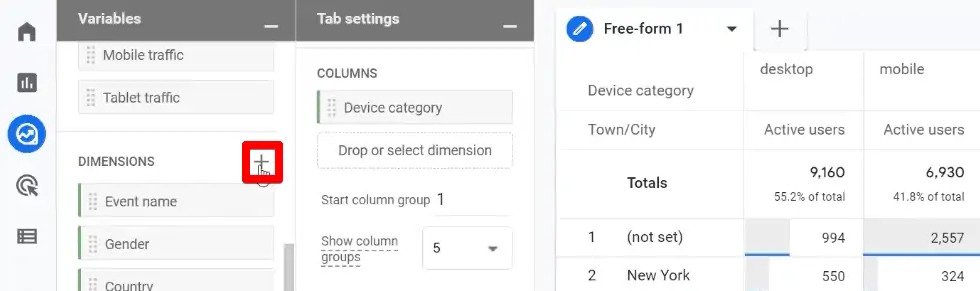
Luckily, you are not limited to only the ones listed here. To illustrate how you can add other segments, dimensions, or metrics, let’s add the first user source dimension.
Click on the plus sign beside the dimensions header.
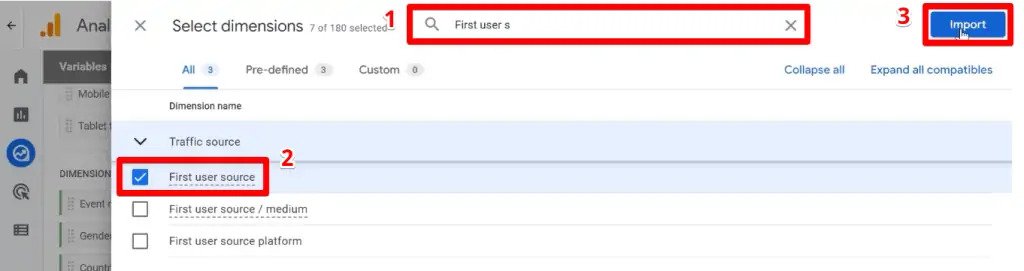
Search for the first user source and select it from the list of dimensions. Finally, click on Import.
Building a Report
Now, let’s build our first simple report.
First, let’s delete all the pre-configured settings by clicking on the button beside the dimension/metric in the rows, columns, and values section.
For your first configuration, let’s say you want to see all the events taking place on the website, as well as the event count.
You have two options on how you can add the configurations to your report. You can either drag and drop the dimension or metric to the corresponding section or simply double-click on it.
Since it is more convenient, double-click on the Event name dimension and the Event count metric.
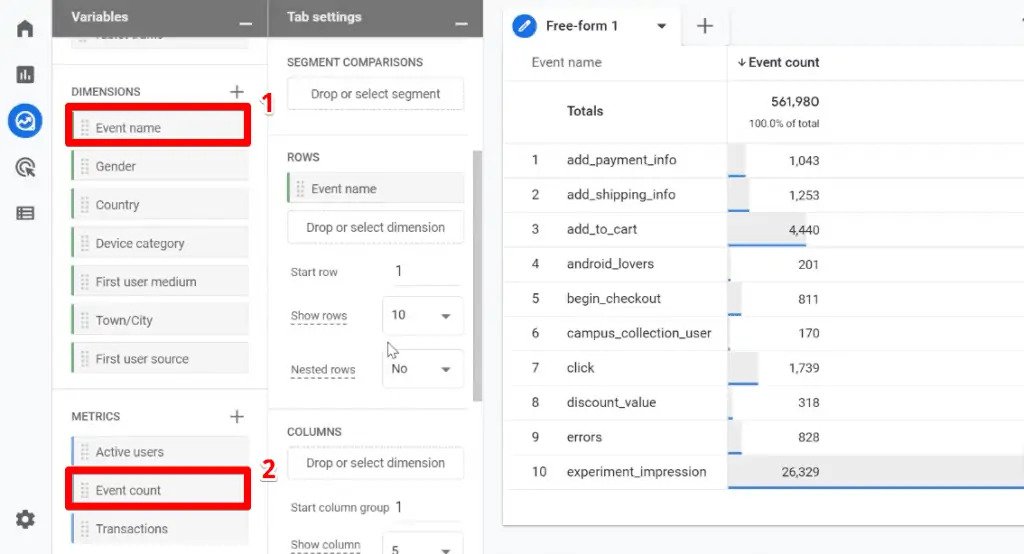
You will notice that it automatically puts the event name dimension in the rows section and the event count metric in the values section.
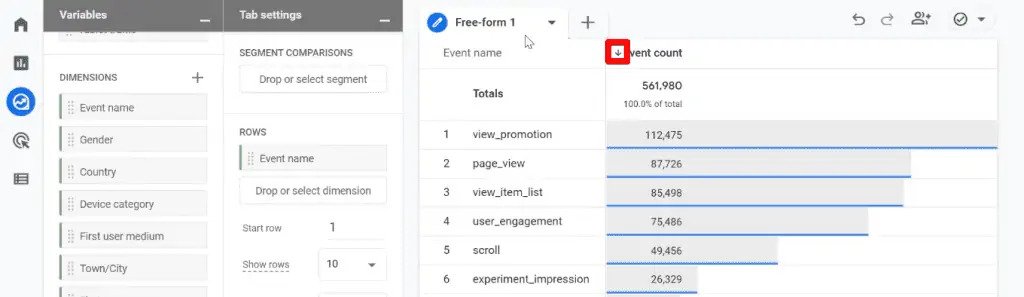
You can easily sort the results by clicking on the arrow beside the event count header.
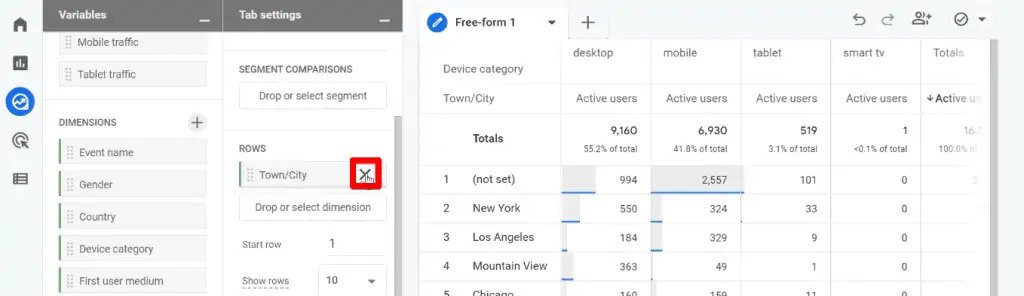
Let’s say you want to add a second dimension to your report. You can simply drag the dimension to the columns section of the tab settings portion or by double-clicking on it.
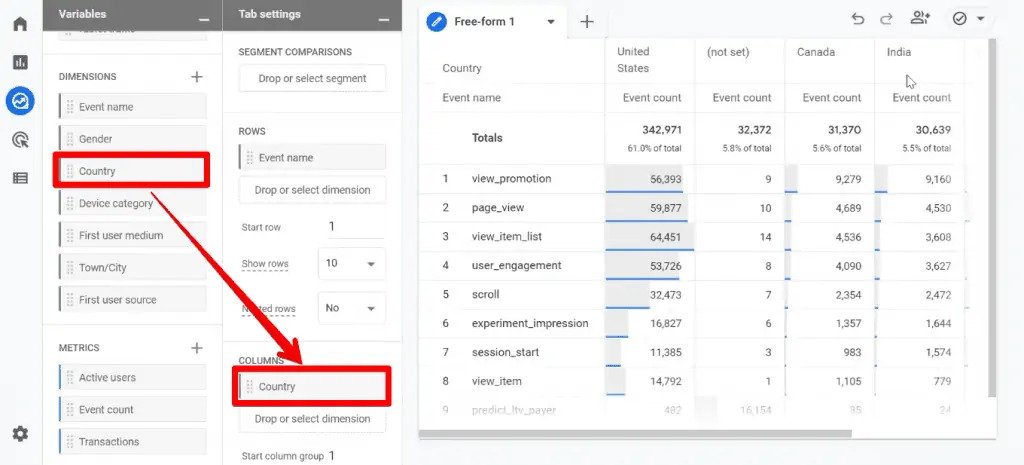
To illustrate, let’s drag the Country dimension to the columns section.
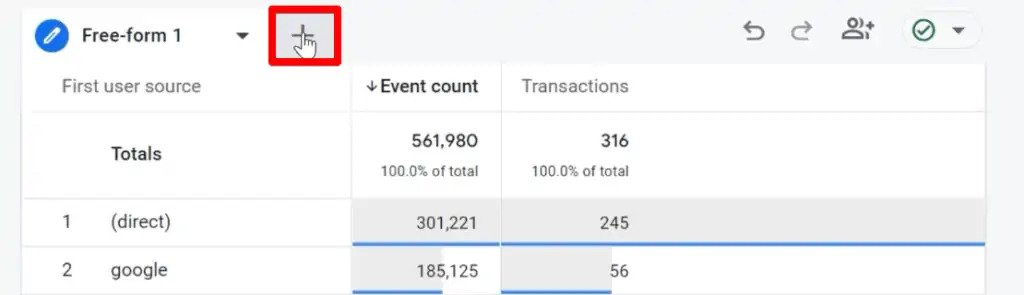
Let’s create another report by first clearing the dimensions and metrics in our current report.
For this new report, double-click the First user source, Event count, and Transactions.
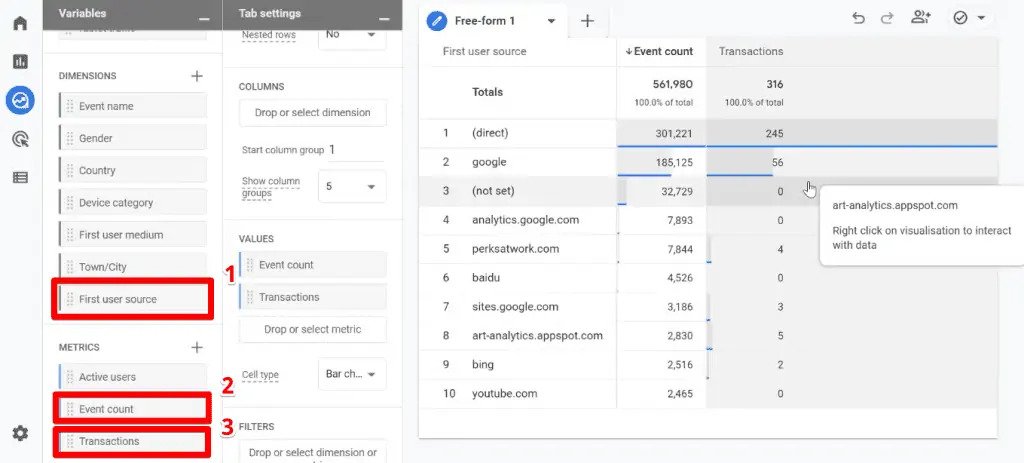
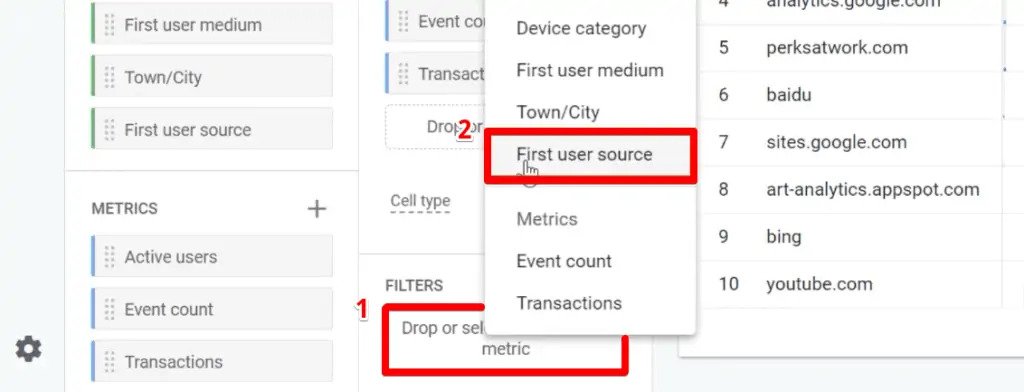
Let’s try adding a filter to this report. For the first filter, let’s say you only want to work with data from Baidu.
Click on the Drop or select dimension or metric → First user source.
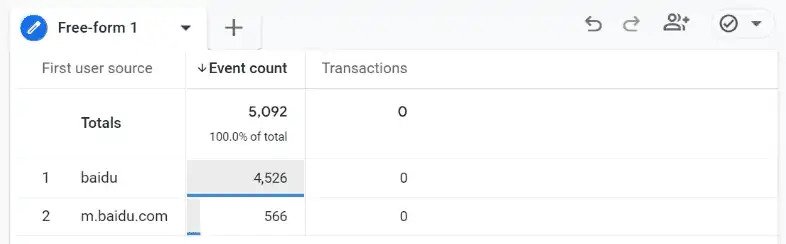
Set the filter as “contains Baidu”, then click Apply.
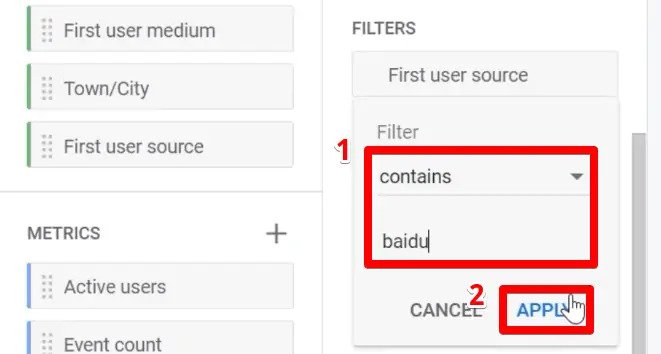
This leaves only the first user sources that contain Baidu to be left in the table.
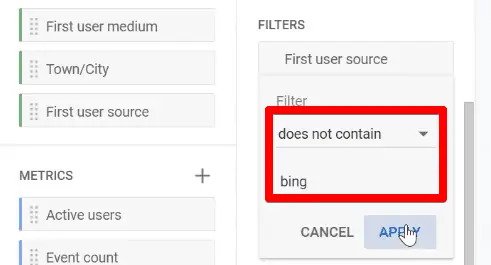
You can also create a filter that excludes certain keywords.
For example, if you want to exclude first user sources from Bing, the filter should be set as “does not contain Bing”.
Moreover, you can also create multiple conditions in your filters which must be fulfilled at the same time.
The last feature we will discuss in the explorations section is the Tabs section.
You can have different tabs to display your visualization and explorations can contain up to 10 visualizations.
To add a new tab, click on the + button in the tabs section.
Summary
So, that’s all you need to know about Google Analytics 4.
We’ve covered the steps of setting up GA4 on your website, the different GA4 event types, and how to set up custom events.
Moreover, we have also gone through the standard reports that come pre-configured with your Google Analytics 4 property, and how to analyze your data further using the free-form exploration technique.
Continue your Google Analytics 4 journey by learning the GA4 metrics to better understand your user behavior.
What kinds of data do you wish to pull from your website/app? Which GA4 feature is the most appealing or useful to you as a data analyst? Let us know in the comments below!
Article first posted on MeasureSchool website on 9th September 2022, written by Sofija Bychkovksa